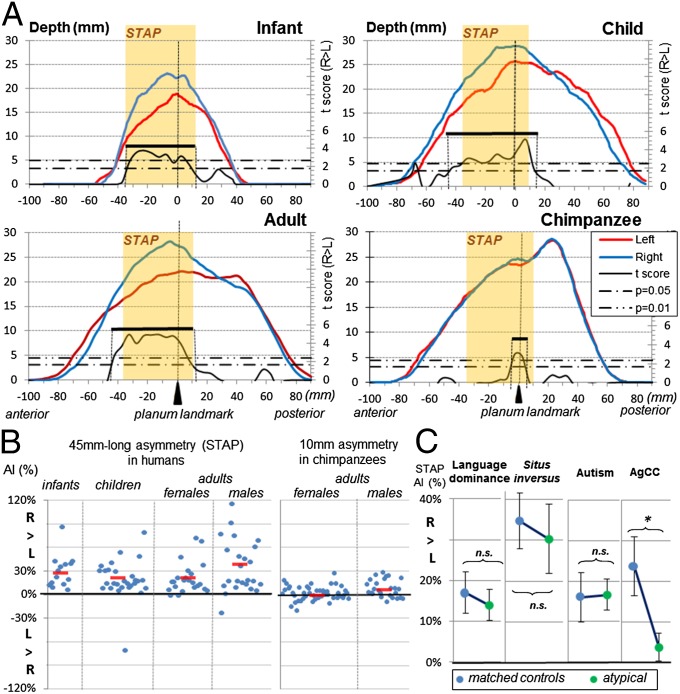
Fig. 2.
(A) Left (red line) and right (blue line) STS depth profiles from the temporal pole to its parietal caudal end. Depth profiles are shown for infants, right-handed children, adults, and chimpanzees. The asymmetrical part of the STS is computed for each group by permutation tests over 5-mm-long intervals along the sulcus. Two statistical thresholds (Pcorr = 0.05; Pcorr = 0.01) are shown by horizontal dashed-and-dotted lines. The extent of the asymmetrical segment is given by the range of the Student t variable (black line) above the lower threshold and is identified by a black bar (see also Table 1). The extent of the common region across the three typical human groups (STAP) is shown in light orange overlay. (B) STAP per cent in individual typical humans and chimpanzees. Mean group values are shown by a short red line. (C) STAP in atypical human groups, i.e., adults with right lateralization for language, adults with situs inversus (reversed petalia), children with autism spectrum disorders, and children with AgCC. *P < 0.05. n.s., not significant.

