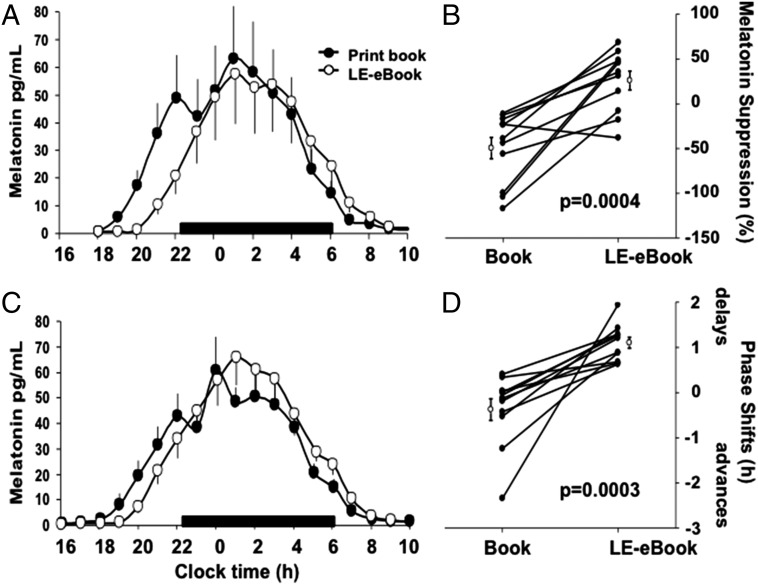
Fig. 2.
Melatonin suppression (A and B) and phase shifting (C and D) during and after the LE-eBook and print book reading conditions. (A) Average waveforms of melatonin (±SEM) during the fifth night of each reading condition. The black bar denotes the scheduled sleep episode (22:00–06:00). (B) Percent suppression for each condition for each participant (filled symbols) and group average (±SEM; open symbols). (C) Average waveforms of melatonin (±SEM) on the evening/night after each reading condition. (D) Average phase shift of melatonin onset for each condition for each participant (filled symbols) and group average (±SEM; open symbols). The main effect of Condition was significant (P < 0.05, mixed model).

