
Fig. 3.
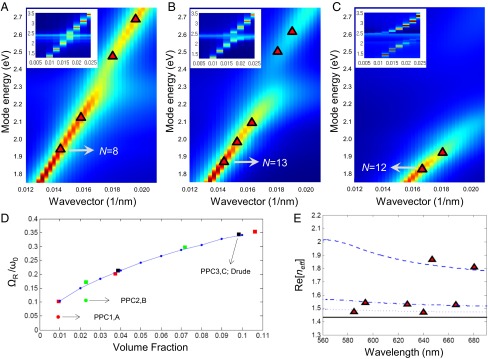
Calculated photonic mode dispersion, mode splitting, and effective mode index of PPC1–3. (A) The spectral density in the ΓN direction is presented for PPC1 (red is high, blue is low). Log10 scale is used. Red triangular markers are the FPMs in Fig. 2B (red markers). They are assigned to peak positions of the spectral densities and the mode number (N) is assigned on one FPM. (Inset) The same spectral density calculated based on the Drude model for gold (where there is no interband transition). (B and C) The same information as in A for PPC2 and PPC3. (D) The mode splitting to plasmonic mode energy ratio, , is shown in terms of gold volume fraction. Blue dots are calculated based on EMT with the Drude model for gold. Squares are generated by a FDTD photonic crystal analysis with the Drude model for gold (red, green, and black: nanoparticle diameters 5.6, 9.0, and 20 nm; volume fraction of PPC3 indicated for 20 nm), and circles with experimentally measured gold permittivity (red and green: nanoparticle diameters 5.6 and 9.0 nm; PPC1 and PPC2). (E) EMT-based effective indices, Re[neff], for PPC1 (dotted line), PPC2 (dash-dot line), and PPC3 (dashed line). The index of the silica host medium (black solid line) is added as a reference. Red markers are Re[neff] based on the FPMs in A–C.