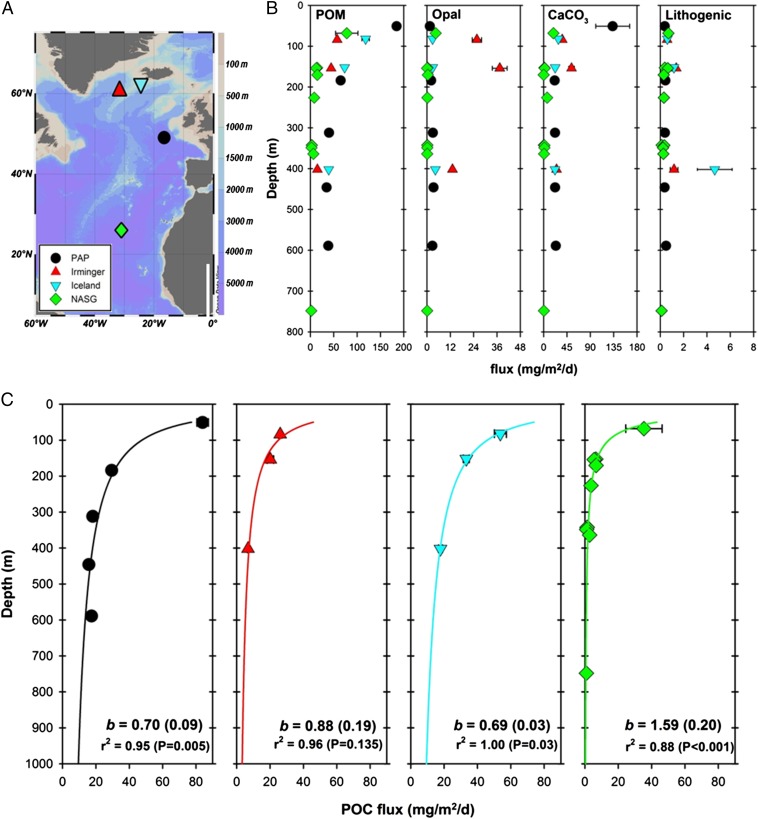
Fig. 1.
(A) Bathymetry map of the North Atlantic showing the locations of four multiple PELAGRA trap deployments; (B) measured fluxes of POM, opal, CaCO3, and lithogenic material at each site; (C) corresponding measured POC fluxes at each site, with profiles fitted using Eq. 1 and extrapolated between 50 m and 1000 m depth. Error bars represent relative SD from replicate measurements and are generally smaller than symbols. POC flux plots show the calculated b value along with SE, r2 value, and P value.

