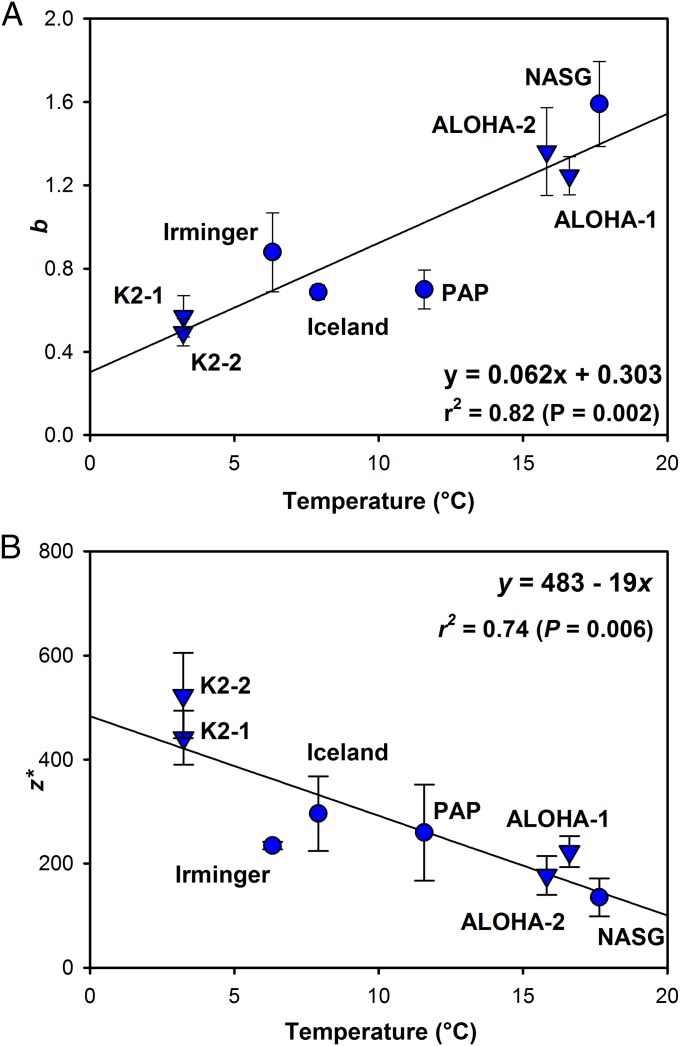
Fig. 2.
Scatter plots of temperature versus (A) the b coefficient of POC flux attenuation from Eq. 1 and (B) the remineralization length scale, z*, from Eq. 2. Values of b or z* calculated for POC flux measurements made with neutrally buoyant sediment traps are plotted against median temperature of the upper 500 m of the water column at each site, along with the resulting regression lines. Four North Atlantic values (this study) are shown by circles; four North Pacific values (16) are shown by inverted triangles. Error bars represent SE of b and z* values.

