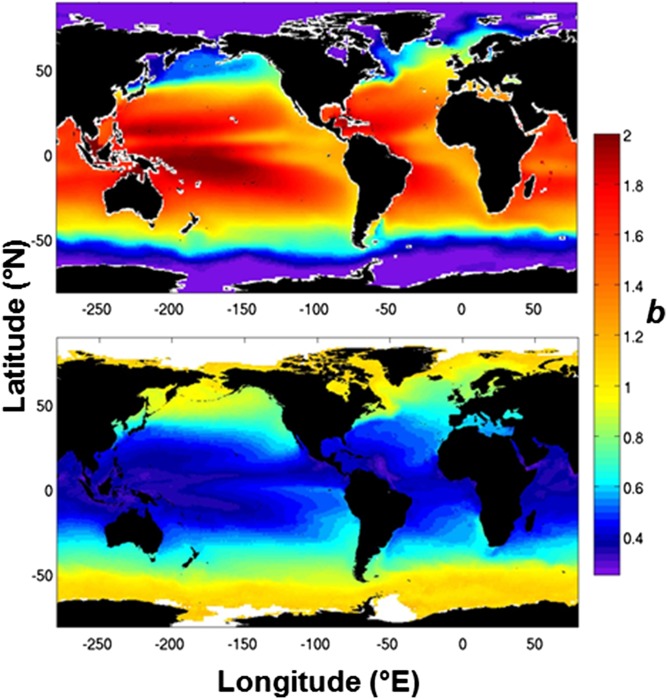
Fig. 3.
Global maps of b values from (Upper) the relationship between mesopelagic POC flux attenuation and upper water column (500 m) median temperature applied to World Ocean Atlas climatological data (29) and from (Lower) application of algorithms to satellite data, based on studies of thorium-derived POC export and POC flux to deep-sea sediment traps (adapted from ref. 28).

