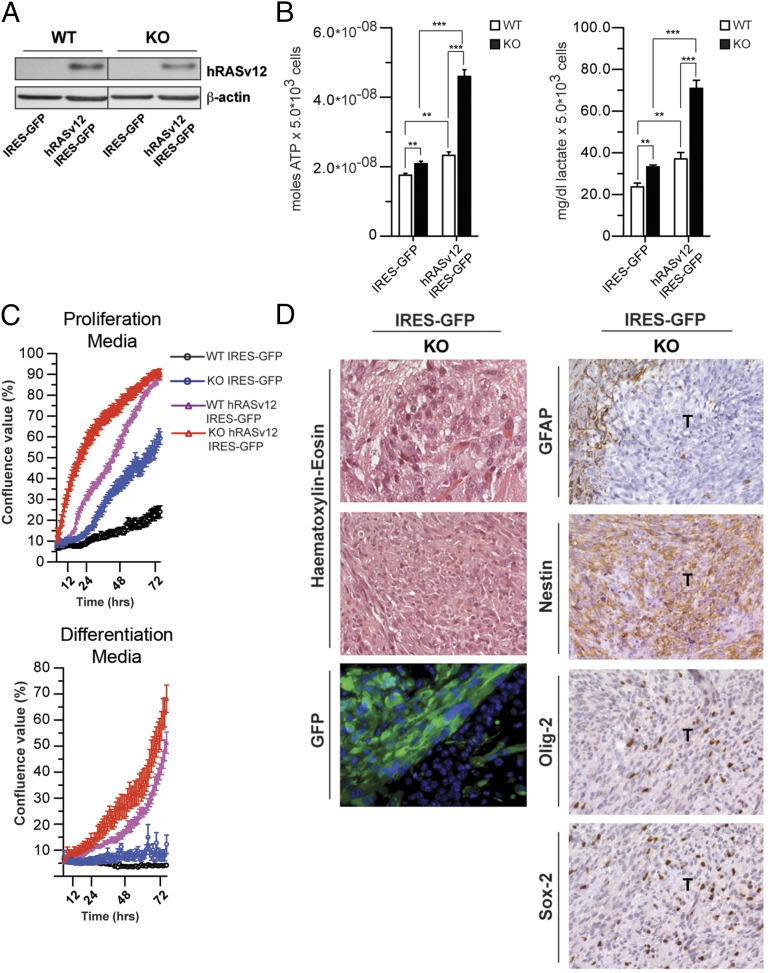
Fig. 4.
ETC-impaired cells are susceptible to neoplastic transformation. (A) Western blot analysis of WT and KO (KO1 preparation) NPCs infected with hRASv12 IRES-GFP or IRES-GFP alone. (B) ATP and lactate production under basal conditions in WT and KO NPCs transduced with either IRES-GFP or hRASv12 IRES-GFP retrovirus. (**P < 0.01, ***P < 0.0001, Student’s t test; error bars are SD). (C) Growth curves analysis and representative images of WT and KO cells transduced with control (IRES-GFP) or hRASv12 IRES-GFP retroviral particles in proliferation (Top) and differentiation (Bottom) culture conditions. (D, Left) Histological and fluorescence microscopy analysis of allografts, derived from KO IRES-GFP cells. WT and KO cells were cultured as neurospheres, transduced with IRES-GFP, and orthotopically allografted into the caudoputamen of NOD/SCID immunosuppressed mice. No tumors were obtained in mice in which WT cells were xenografted. H&E histology shows large, cytoplasm-rich cells in KO tumor cells. Anti-GFP immunostaining was used to identify the tumor-initiating cells (bottom row). (Right) Immunohistochemical staining for the astrocyte marker GFAP shows that all tumors are negative with positive cells only in the adjacent host tissue. Immunohistochemical analysis of the neural stem cell marker Nestin shows a strong, diffuse labeling of tumor cells. The neural progenitor marker Olig-2 shows that many, but not all, of tumor cells present strong nuclear expression. The progenitor cell marker Sox-2 is expressed in a smaller subset of tumor cells. [Scale bar: 80 µm (first row), 320 µm (second row), and 160 µm (remaining panels).]

