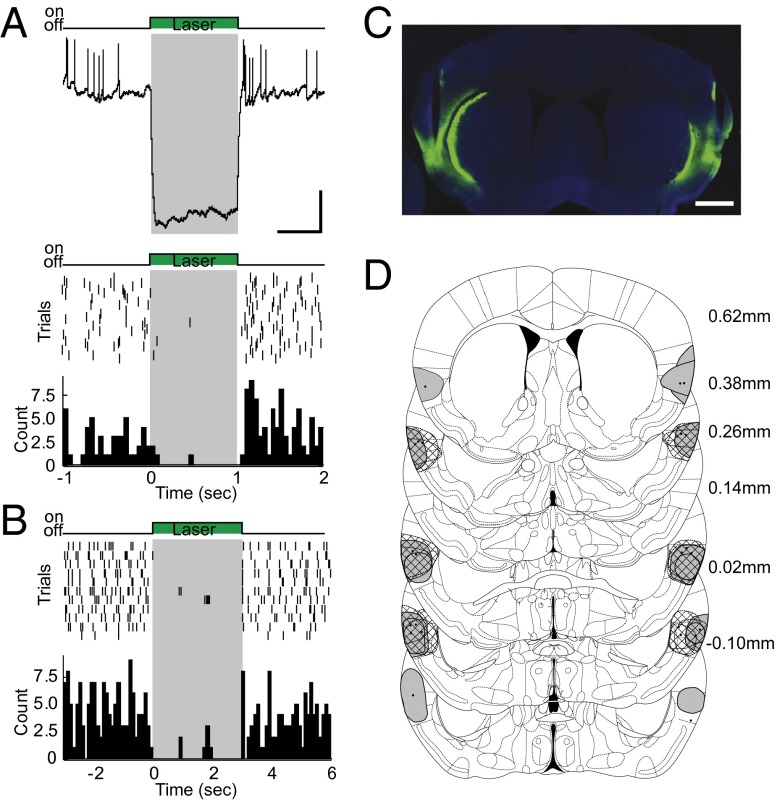
Fig. 4.
Optogenetic silencing in the IC. (A) Effectiveness of photostimulation in slices of the IC. (Top) In vitro whole-cell, current-clamp recording showing the average hyperpolarizing response to photostimulation in a halorhodopsin-expressing neuron. (Scale bar: vertical, 10 mV; horizontal, 0.5 s.) (Bottom) Raster plot and PSTH from an in vitro cell-attached recording showing silencing of spontaneous spiking as recorded in a cell-attached mode. The x axis represents time, and the y axis represents trials for the raster plot and counts for the PSTH. Gray shading and the green box illustrate the timing of laser stimulation. Photostimulation was performed with a 1-s-long single pulse of green light at 10 mW. (B) Raster plot and PSTH showing spiking responses recorded from an IC neuron in vivo from an anesthetized mouse. Gray shading and the green box illustrate the timing of laser stimulation. Photostimulation was performed with a 3-s-long single pulse of green light at 10 mW. (C) Representative section showing viral injection sites and fiber tracks in ICs. (Scale bar: 1 mm.) (D) Reconstruction of placements of viral injection sites and fiber tips (dots). Expression of GFP fluorescence was drawn either as a gray round shape (halorhodopsin) or a round shape filled with diamond (♢, control).

