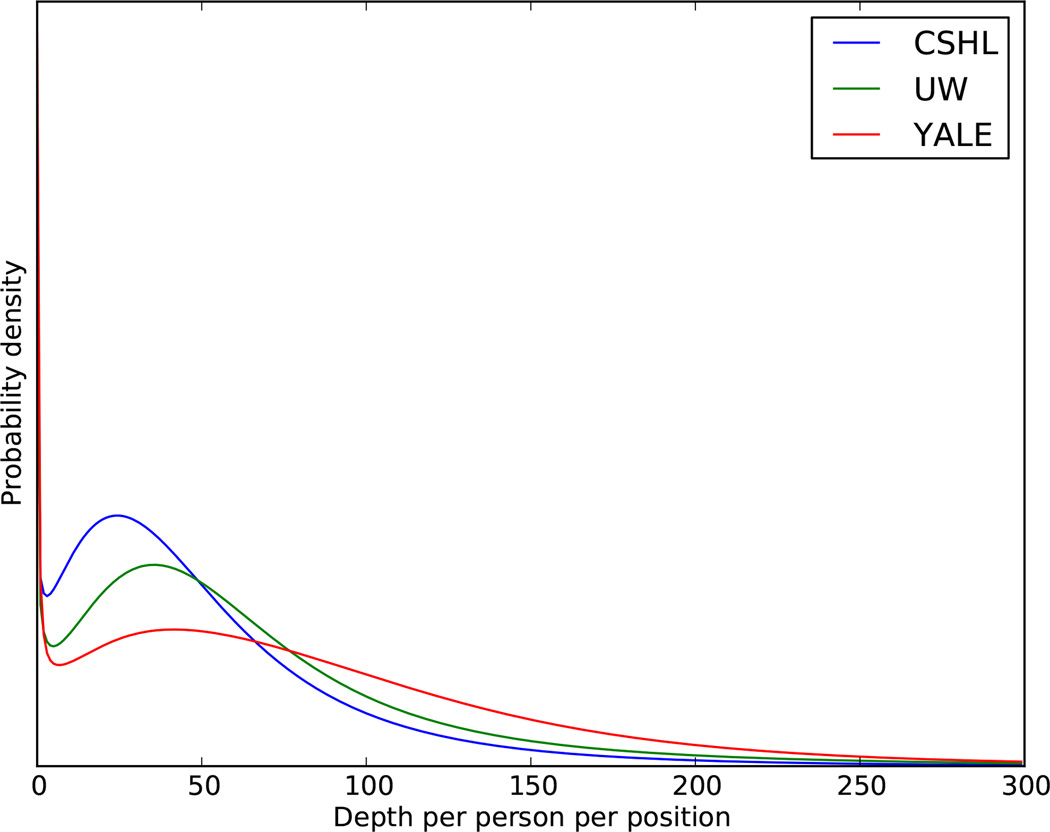
Extended Data Figure 6. Distributions of sequencing depth.
Distributions of sequencing depth (number of sequence reads covering a given genomic position) per person per position for the three sequencing centers are plotted. Center designations are as in Extended Data Figure 1.

