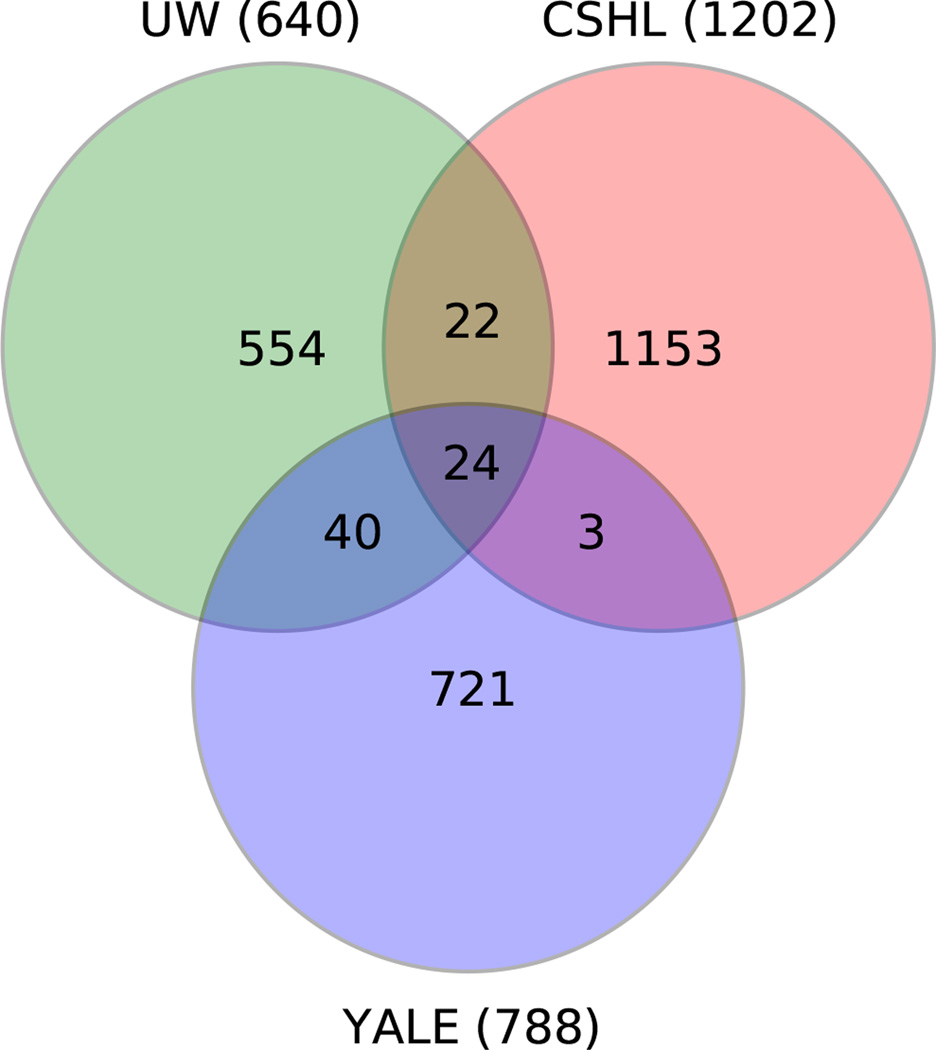
Extended Data Figure 1. Number of families sequenced by center.
The numbers of families sequenced at the three centers are plotted as a Venn diagram. Families sequenced at more than one center are indicated by the overlapping regions between circles. CSHL: Cold Spring Harbor Laboratory; UW: University of Washington, Seattle; YALE: Yale Medical Center.

