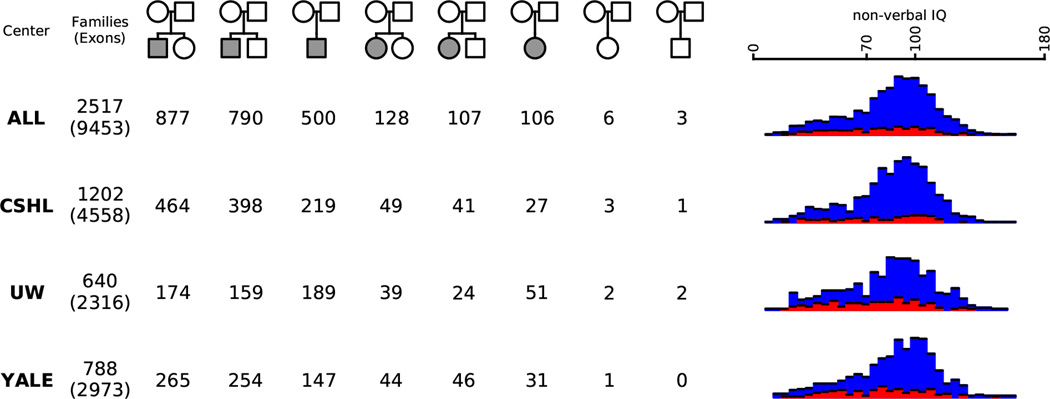
Extended Data Figure 2. SSC sequencing by pedigree type and nonverbal IQ.

A summary of all SSC families sequenced is indicated across the “ALL” row. Numbers of SSC families with complete exome sequencing data are displayed by center in the following rows (see Extended Data Figure 1 legend for center designations). The top number in entries under the “Families” column indicates the total number of families sequenced, and the number in parentheses below indicates the total number of individuals. Family pedigree structures are shown across the top row with gender indicated by shape (square for male, circle for female) and affected status indicated by color (white for unaffected, gray for affected). Distributions of non-verbal IQ within each cohort are shown for male probands (blue) and female probands (red).
