An official website of the United States government
Here's how you know
Official websites use .gov
A
.gov website belongs to an official
government organization in the United States.
Secure .gov websites use HTTPS
A lock (
) or https:// means you've safely
connected to the .gov website. Share sensitive
information only on official, secure websites.

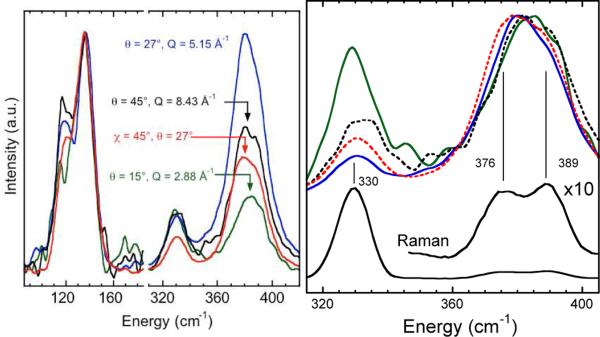
 ), (0°, 27°) (
 ), (0°, 45°) (
 ), and (45°, 27°) (
 ). Right: stretching mode region comparison with Raman spectrum. (All curves normalized to maximum peak height.)