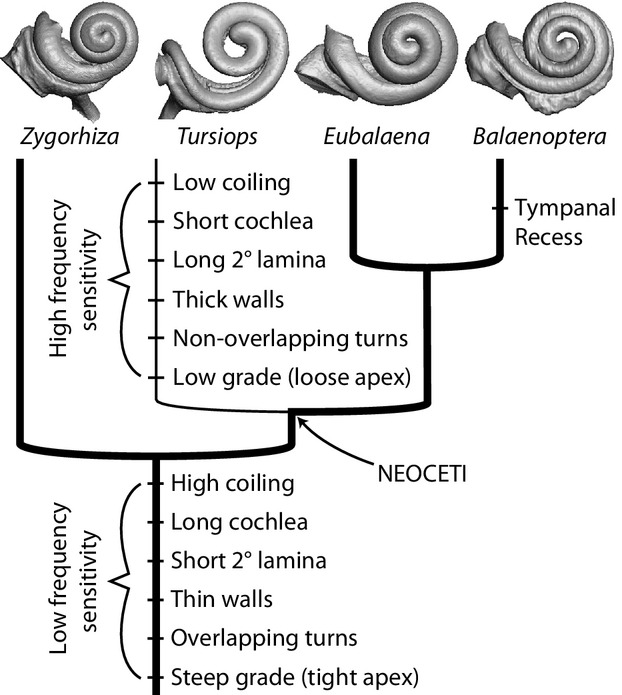
Fig. 7.

Generalized cladogram of Cetacea with mapped characters associated with auditory physiology. Thick line indicates low frequency sensitivity and thin line indicates high frequency sensitivity. Physiological significance of the characters is provided in the text.
