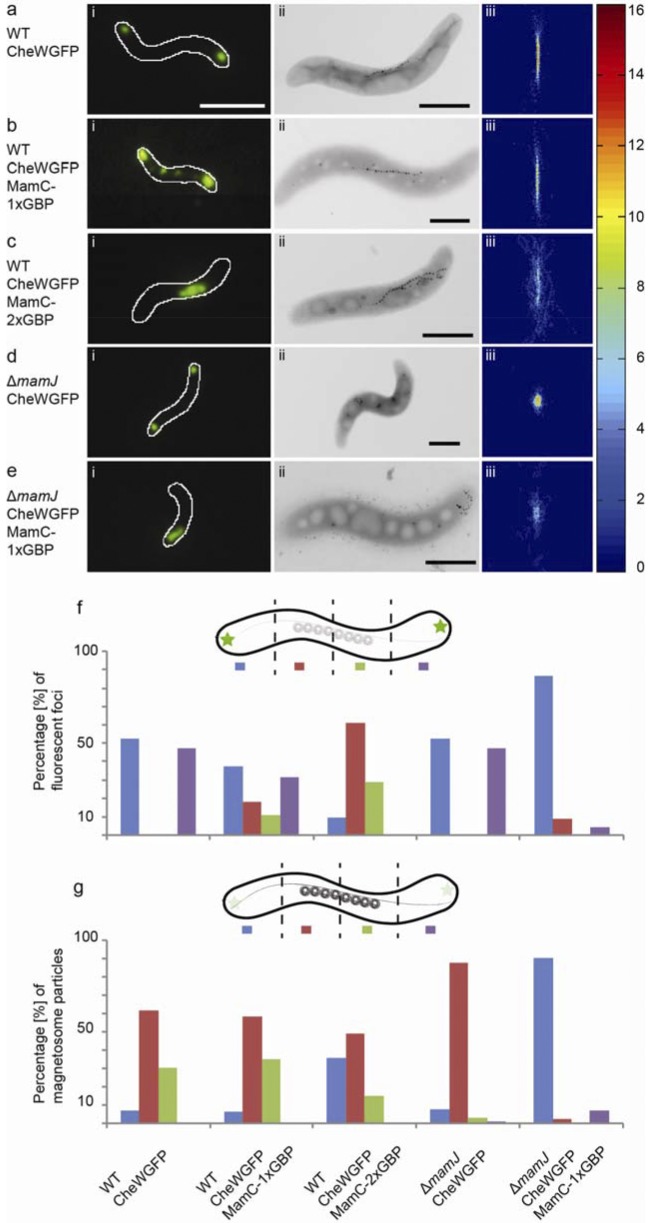
FIG 1 .
Analysis of subcellular CheW1-EGFP and magnetosome localization. Fluorescence (i) and TEM (ii) micrographs of representative M. gryphiswaldense CheW1-EGFP (a), CheW1-EGFP MamC-1×GBP (b), CheW1-EGFP MamC-2×GBP (c), ΔmamJ CheW1-EGFP (d), and ΔmamJ CheW1-EGFP MamC-1×GBP (e) cells. Cells were analyzed by CHAP (iii) and scored for the distribution of fluorescence signal, represented by the percentage of fluorescent foci detected within 4 equidistant compartments (f), and magnetosomes, represented by the percentage of magnetosomes detected within 4 equidistant compartments (g). White scale bar, 2 µm; black scale bar, 1 µm. Twenty cells were aligned by CHAP for each strain, and heat maps display the numbers of magnetosomes. Single cells were segmented into four compartments, and for each strain 20 cells were scored to obtain fluorescence and magnetosome distributions.

