Figure L.
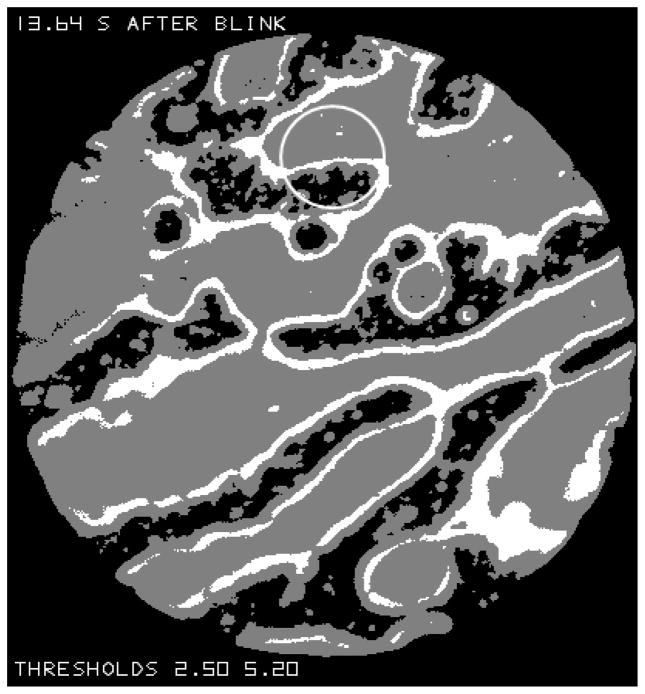
The image from Figure B after it has been “thresholded” so that black regions give reflectance less than 2.5%, white regions give reflectance over 5.2% and grey regions give intermediate reflectance. The grey region marked “a” probably corresponds to relatively thick lipid (see text). The circle near the top corresponds to the 33 μm measurement spot used previously to measure lipid thickness.[17]

