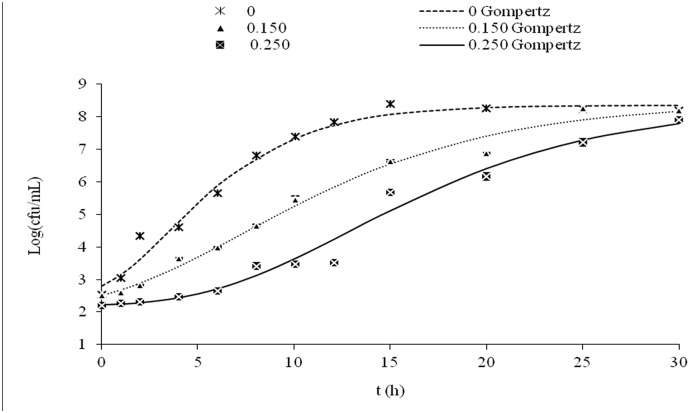
Figure 2. . L. monocytogenes growth curves in reference medium in the presence of different concentrations of citral (μL/mL) with N0 = 102 Log(cfu/mL).
The lines represent the fit of the experimental data to the modified Gompertz model. The standard deviation associated with each average value is expressed by error bars.

