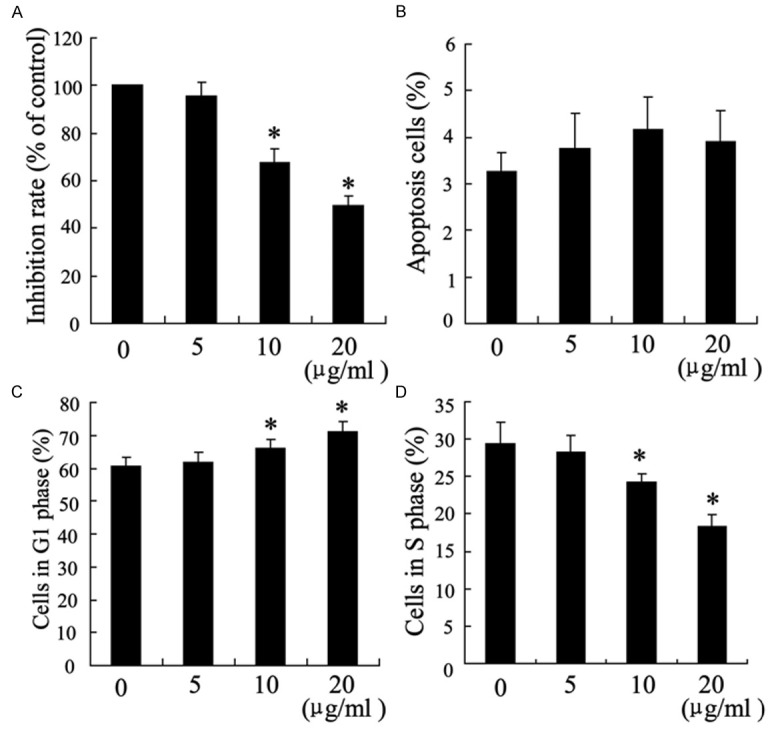
Figure 2.

The effects of chitosan on fibroblasts survival, apoptosis and cell cycle. Fibroblasts were treated with chitosan (0 μg/ml, 5 μg/ml, 10 μg/ml and 20 μg/ml) for 24 hours. 104 cells per ml were used to determine cell survival rate by MTT assays (A). Apoptosis (B) and cell cycle (C, D) were evaluated with Flow Cytometry. *P < 0.05 by Student’s t-test, indicates a significant difference from the group without chitosan treatment. All experiments were repeated three times.
