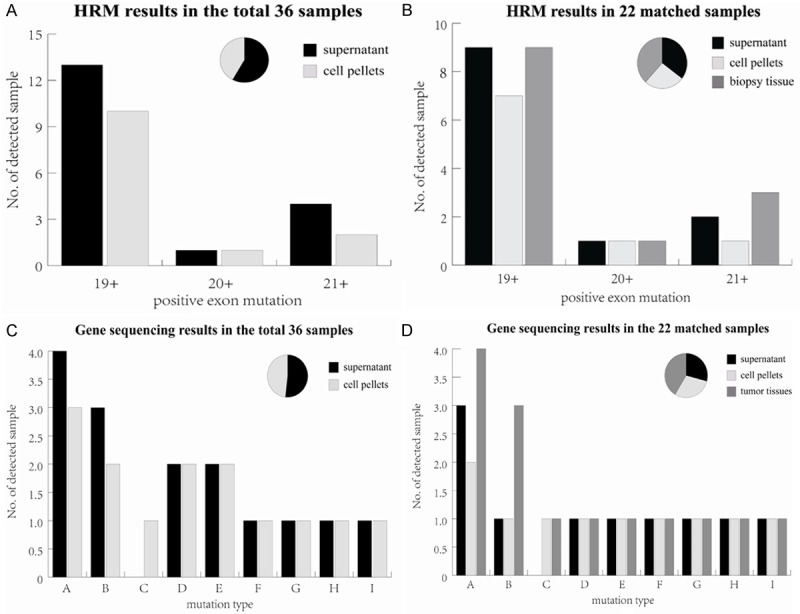
Figure 2.

Comparison of EGFR mutation status among different sample resources detected by HRM analysis and sequencing. A. HRM results from the supernatant and cell pellets of pleural effusion in 36 samples; B. HRM results from the supernatant, cell pellets of pleural effusion and tumor tissues in the paired 22 samples; C. Sequencing results from the supernatant and cell pellets of pleural effusions in 36 samples; D. Sequencing results from the supernatant, cell pellets and tumor tissues in the paired 22 samples. The vertical coordinate shows the number of positive mutation samples detected in different EGFR exons or mutation types listed on the horizontal coordinate (exon 18 was not included since no mutation was detected). Overall, 12 cases were detected in both pleural effusion and tumor tissues using HRM method, 1 case of mutation was only detected in tumor tissue samples. Different efficiency degree was revealed in mutation type A, B and C for the three different sample sources. The pie chart displays the total ratio of positive mutation samples detected in all exons or mutation types using different sample sources. Mutations types represented by each capital letter are: A. 2235_2249del15; B. L858R; C. 2239_2248>C (complex); D. 2240_2257del18; E. 2239_2253del15; F. 2240_2254del15; G. 2239_2256del18; H. 2236_2250del15; I. Ins773 (DNP).
