
Figure 3.
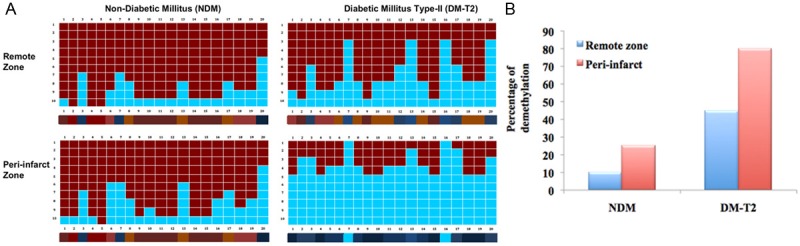
The bisulphate DNA sequencing analysis of Keap1 promoter DNA in remote, peri-infarct zones in myocardium of non-diabetic (NDM) and type-2 diabetic (DM-T2). A. Represent the methylation status of CpG dinucleotides in Keap1 promoter region (between -430 and -110); B. Represent the percentage of demethylation calculated from the bisulphate DNA sequencing.