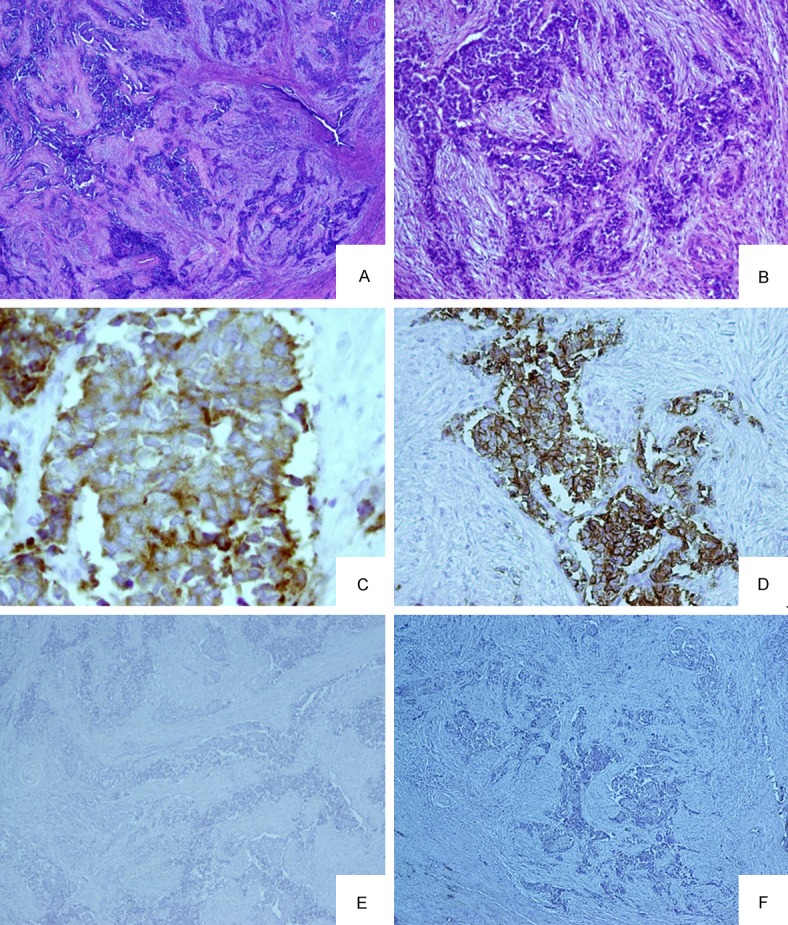
Figure 2.

(A) A low power view of the prostatectomy specimen demonstrates an infiltrative tumor composed of solid nests and trabeculae (40 ×). (B) NE tumor comprised of irregular infiltrative trabeculae with surrounding desmoplasia (100 ×). (C) Tumor cells showing strong membranous staining for neuroendocrine marker synaptophysin (200 ×). (D) Tumor cells demonstrate membranous positivity for CD 56. (E and F) Tumor cells are negative for the expression of prostatic lineage markers PSA (E) and PAP (F).
