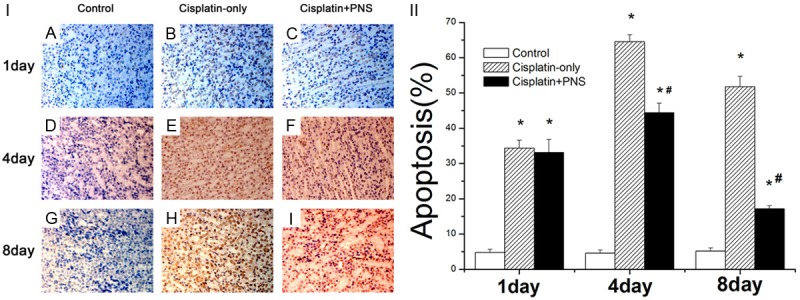
Figure 4.

The effect of PNS on the apoptosis rate of rat renal tissue detected using TUNEL staining. A, D, G: The control group at day 1, 4 and 8; B, E, H: The cisplatin-only group at day 1, 4 and 8; C, F, I: The cisplatin-PNS group at day 1, 4 and 8. *P < 0.01 when compared with the control group, #P < 0.01 when compared with the cisplatin-only group.
