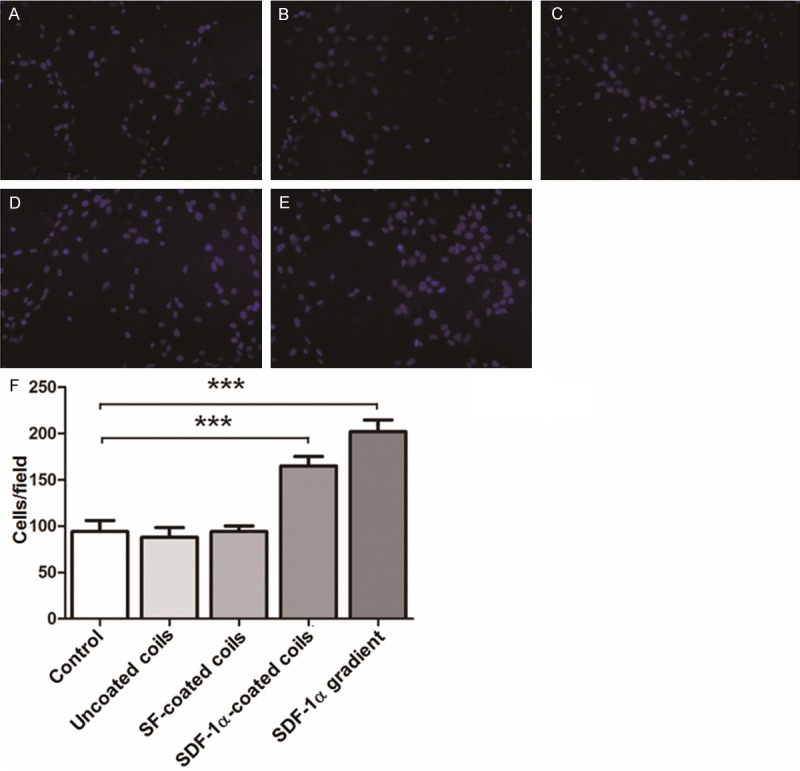
Figure 3.

EPC migration. Migration of EPCs in medium containing (A) nothing (control), (B) unmodified coils, (C) SF-coated coils, (D) SDF-1α-coated coils, and (E) SDF-1α gradient (10 ng/ml) was measured using modified Boyden chamber migration assay (200×). (F) Quantification of EPC migration. Values are means ± SD (n = 3). **P < 0.01 compared with control; ***P < 0.001 compared with control.
