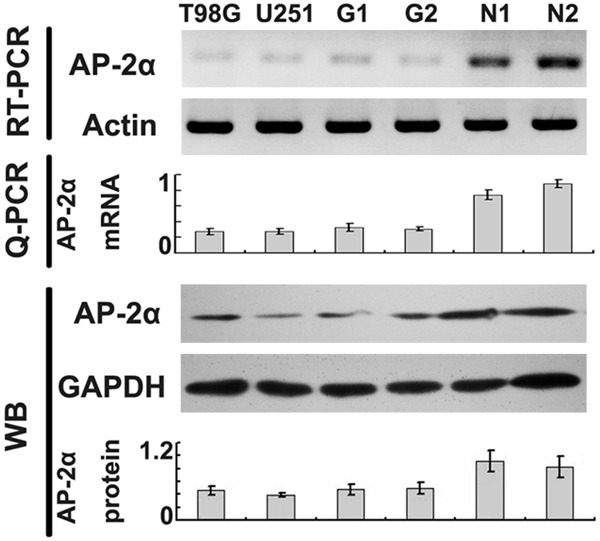
Figure 1.

AP-2α expression in glioma. AP-2α expression in glioma cell lines (U251 and T98G), glioma tissues (G1 and G2) and normal brain tissues (N1 and N2). RT-PCR (upper), Q-PCR (middle) and western blot analysis (lower, with semiquantitative histograms) showed decreased AP-2α levels (relative to actin or GAPDH, mean ± SD of three independent experiments, P < 0.05) in glioma cell lines and tissues compared with that in normal brain tissues.
