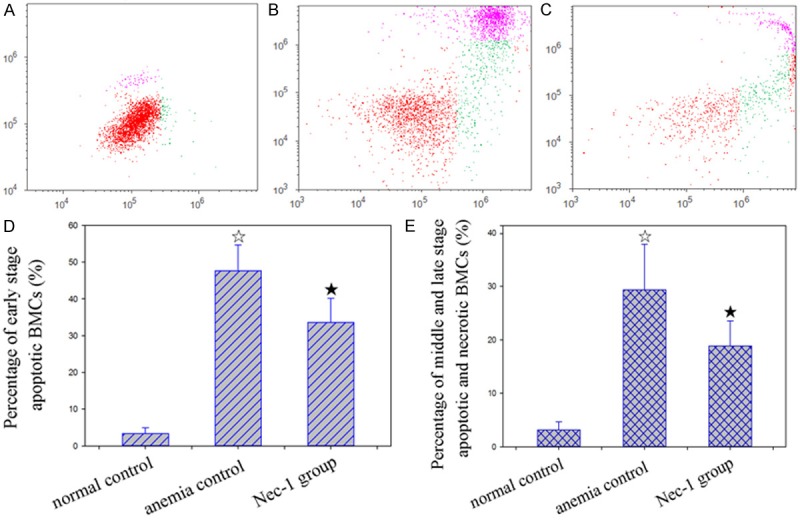
Figure 4.

Effect of Nec-1 on death of bone marrow cells in mice with AA. A, B, C: Gated region of flow cytometric analysis. Green scatter dots indicates the early stage apoptotic population, pink scatter dots indicates the middle and late stage apoptotic and necrotic population. A: Normal control, B: Anemia control, C: Nec-1 group. D: Percentage of early stage apoptotic BMCs, E: Percentage of middle and late stage apoptotic and necrotic BMCs. ☆: P < 0.05, compared with normal control. ★: P < 0.05, compared with anemia control.
