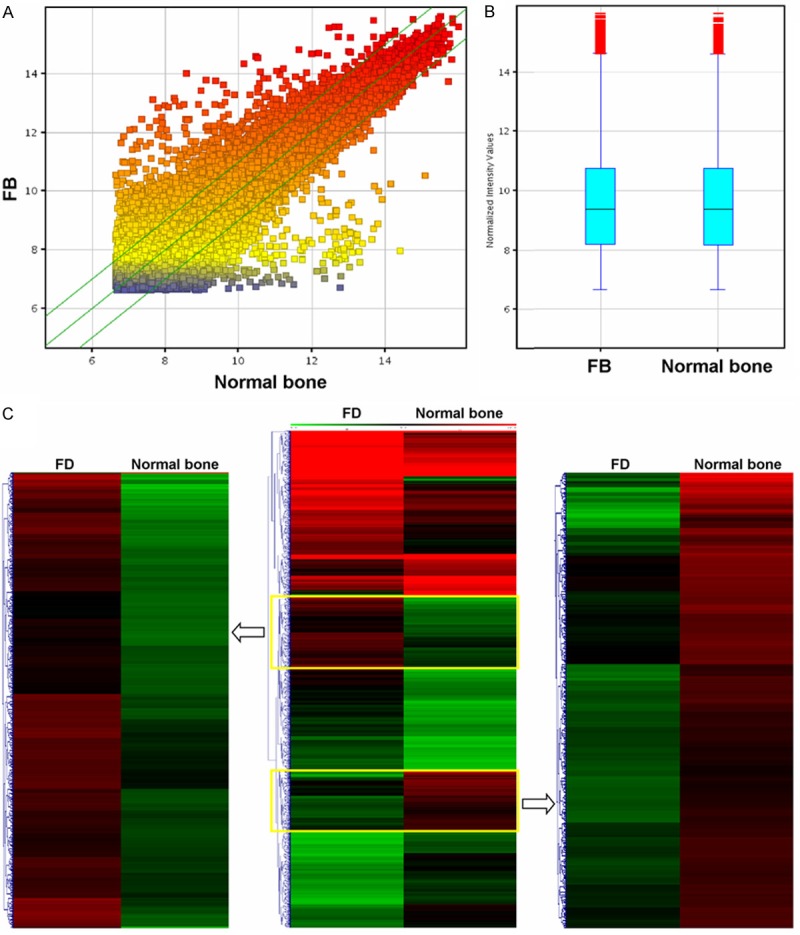
Figure 1.

Comparison of mRNA expression profiles between fibrous dysplasia and normal bone samples. A. Distributions of a dataset for mRNA profiles after normalization as measured by box plot. B. mRNA expression variations between fibrous dysplasia and normal bone samples as measured by scatter plot. The values of the X and Y axes in the scatter plot are the averaged normalized signal values of the group (log2 scaled). The green lines are fold change lines (the default fold change given is 2.0). C. Hierarchical clustering of pooled fibrous dysplasia and normal bone samples using the 3973 differential gene sets.
