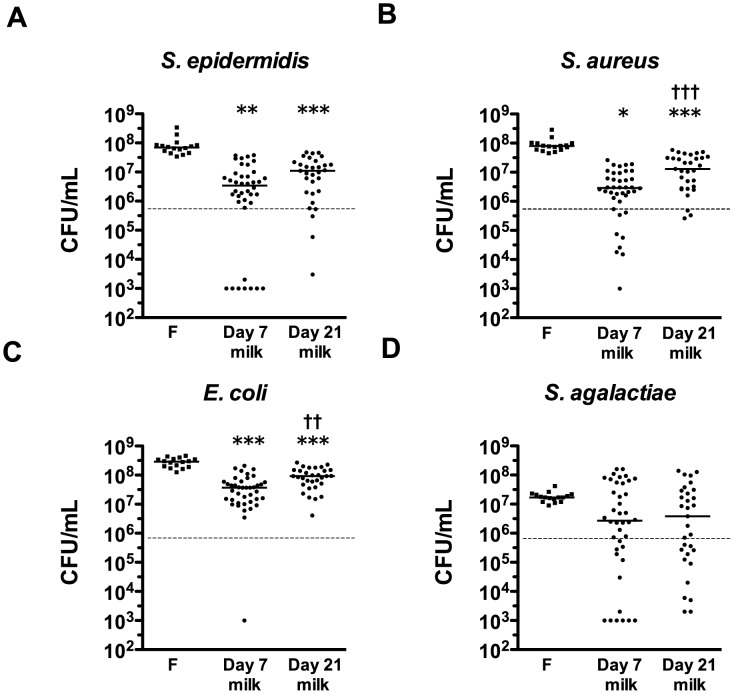
Figure 2. Bacterial growth-inhibition activities of breast milk samples.
Colony-forming units of (A) S. epidermidis; (B) S. aureus; (C) E. coli; or (D) S. agalactiae, after 4 h incubation in either LBWF (F; n = 16), day 7 (n = 40) or day 21 (n = 31) skimmed preterm breast milk samples from participants in the case-control study. The dashed line shows median starting inoculum. Data show individual and median values on a log scale. A value of 103 CFU/mL was assigned to samples where the colony count was below the limit of detection of the assay. Symbols depict the groups where statistically significant comparisons were made (level of significance indicated by multiple symbols; e.g. *p <0.05, **p<0.01, ***p<0.001), comparing growth in LBWF to growth in preterm breast milk samples by ANOVA with Dunn’s multiple comparison test (*) or comparing growth in day 7 and day 21 paired breast milk samples by Wilcoxon signed-rank tests (†).

