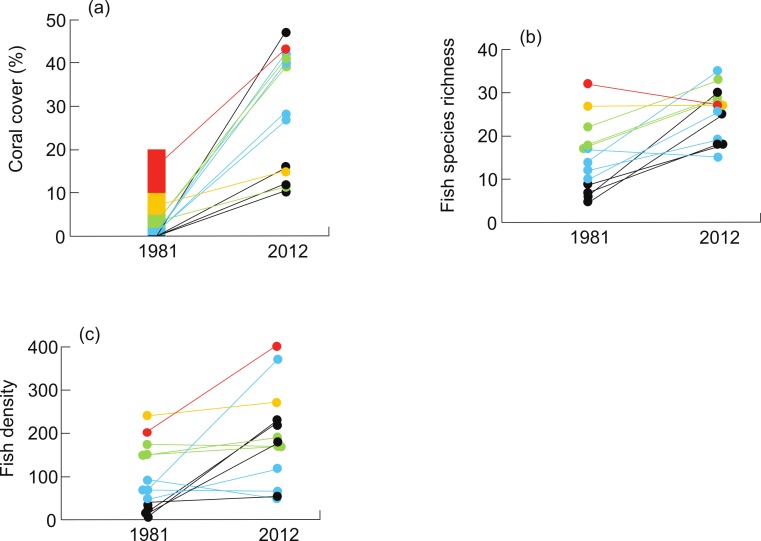
Figure 2. Changes in (A) live coral cover, (B) fish species richness (# fish species per 250 m2), and (C) fish density (# fish per 250 m2) on coral reefs of the Mataiva lagoon between 1981 and 2012.
Each line represents a site, and the trajectory for each site is colour-coded to match the initial category of coral cover reported for 1981 in Bell & Galzin (1984): 0%, black; <2%, blue; 2–<5%, green; 5–10%, orange; >10%, red. Some points with similar values are offset for clarity.

