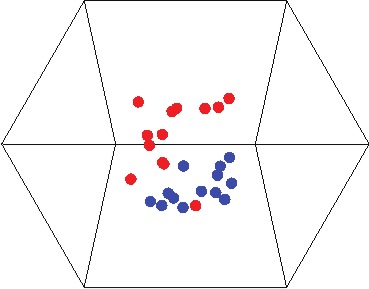
Figure 3. Multidimensional scaling plot of reef fish community composition from the Mataiva Atoll lagoon, French Polynesia.

Each point represents the reef fish assemblage of a pool within the lagoon in 1981 (red points) and 2012 (blue points). The low stress value (0.08) suggests that the three-dimensional depiction shown accurately reflects differences among communities.
