
Figure 4. Relationships between live coral cover and (A) reef fish species richness (# fish species per 250 m2) and (B) density (# fish per 250 m2) in 1981 (red points and regression lines) and in 2012 (blue points and regression lines).
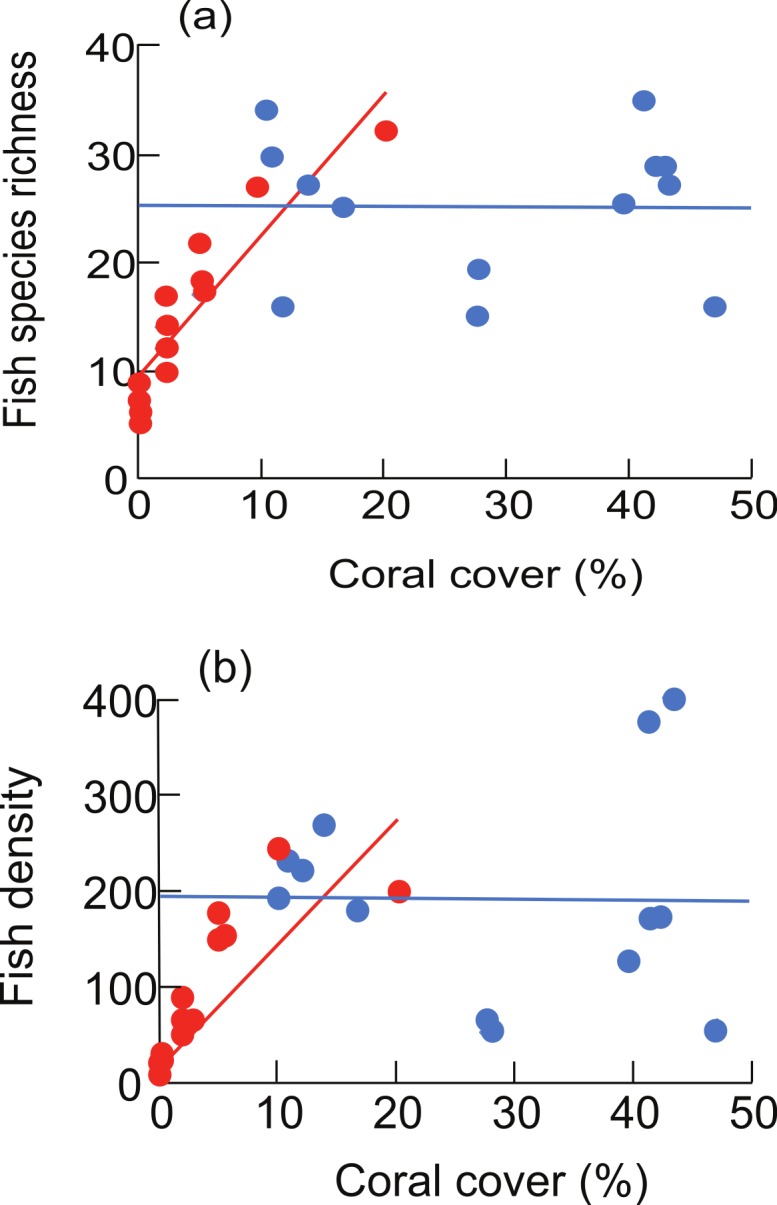
Superimposed points are offset slightly for clarity. Regression equations (A) 1981: Y = 0.53∗X + 11.9; 2012: Y = −0.006∗X + 25.4; (B) 1981: Y = 11.1∗X + 53.1; 2012: Y = −0.12∗X + 196.4.