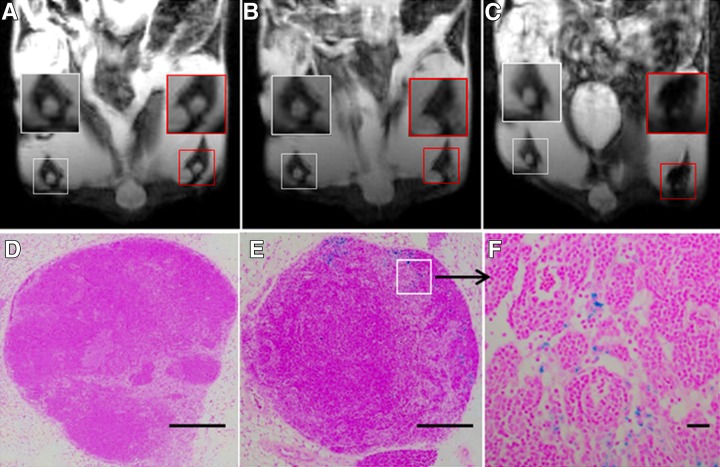
Figure 3:
A–C, Representative coronal T2-weighted MR images of bilateral popliteal LNs in a mouse model of pancreatic carcinoma after injection of 1 million labeled dendritic cells into the left footpad. Images were obtained, A, prior to dendritic cell administration, B, 6 hours after injection, and, C, 24 hours after injection. White boxes = right popliteal LNs, red boxes = left popliteal LNs. D, E, Corresponding Prussian blue–stained slices from popliteal LNs (collected immediately after 24-hour postinjection MR imaging) in, D, right popliteal LN, and, E, left popliteal LN. F, High-magnification image corresponding to the inset (square) in E. Scale bars for D and E = 5 mm; scale bar for F = 50 μm.

