
Fig. 2.
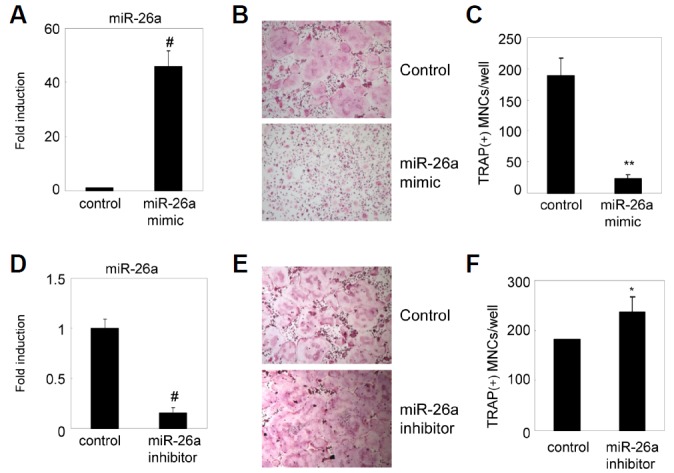
miR-26a inhibits RANKL-induced osteoclast formation. BMMs were cultured for 2 days in the presence of MCSF and RANKL. (A–C) Two-day-old pre-OCs were transfected with the miR-26a mimic or a negative control. (A) Expression level of miR-26a was detected by qRT-PCR. Data represent means ± SD of triplicate samples. #p < 0.0005 vs. control. (B, C) Transfected pre-OCs were cultured for an additional 24 h with M-CSF and RANKL. (B) Cultured cells were fixed and stained for TRAP. (C) Numbers of TRAP + MNCs were counted. Data represent means ± SD of triplicate samples. **p < 0.001 vs. control. Results are representative of at least three independent sets of similar experiments. (D–E) Pre-OCs were transfected with miR-26a inhibitor or negative control. (D) Expression level of miR-26a was detected by qRT-PCR. Data represent means ± SD of triplicate samples. #p < 0.0005 vs. control. (E, F) Transfected pre-OCs were cultured for an additional 24 h with M-CSF and RANKL. (E) Cultured cells were fixed and stained for TRAP. (F) Numbers of TRAP+MNCs were counted. Data represent means ± SD of triplicate samples. **p < 0.05 vs. control. Results are representative of at least three independent sets of similar experiments.