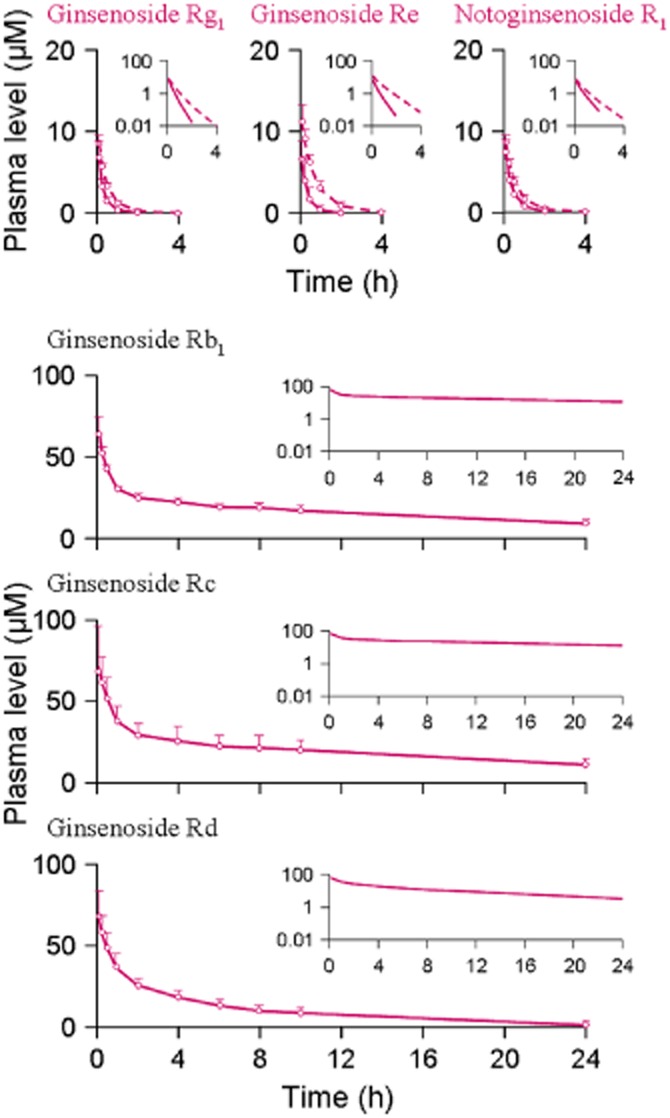
Figure 2.

Plasma concentrations of the ppt-type ginsenoside Rg1, ginsenoside Re and notoginsenoside R1 and the ppd-type ginsenosides Rb1, Rc and Rd over time after a bolus i.v. dose of individual compound at 2.5 μmol·kg−1 in normal rats (solid lines for both types of ginsenosides) and rifampin-treated rats (dashed lines for the ppt-type ginsenosides only). The data represent means and SDs from three independent experiments where each rat group was assayed in triplicate.
