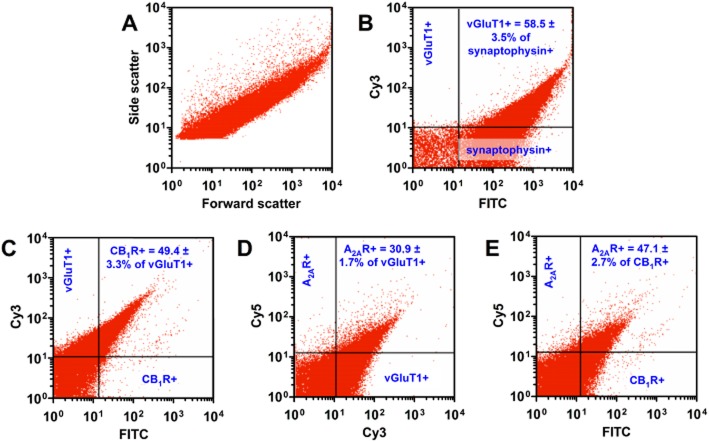
Figure 1.
Flow-synaptometric analysis of immunolabelled Percoll-gradient purified striatal synaptosomes. (A) Representative flow synaptometry plot of striatal synaptosomes for size (forward scatter is proportional to the particle diameter) and for complexity/granularity (side scatter). (B) Representative plot and statistics of synaptosomes double-labelled for synaptophysin (a marker of synaptosomes) and vGluT1 (a marker of corticostriatal terminals). (C and D) Representative plots and statistics of synaptosomes labelled for vGluT1/CB1 receptor (C) and vGluT1/A2A receptor (D) respectively (the two graphs are derived from the same triple-labelled sample). (E) Representative plot and statistics of vGluT1-positive synaptosomes expressing CB1 and A2A receptors. Note that most of the nerve terminals staining positive for A2A receptors (A2AR) were also positive for CB1 receptors (CB1R).

