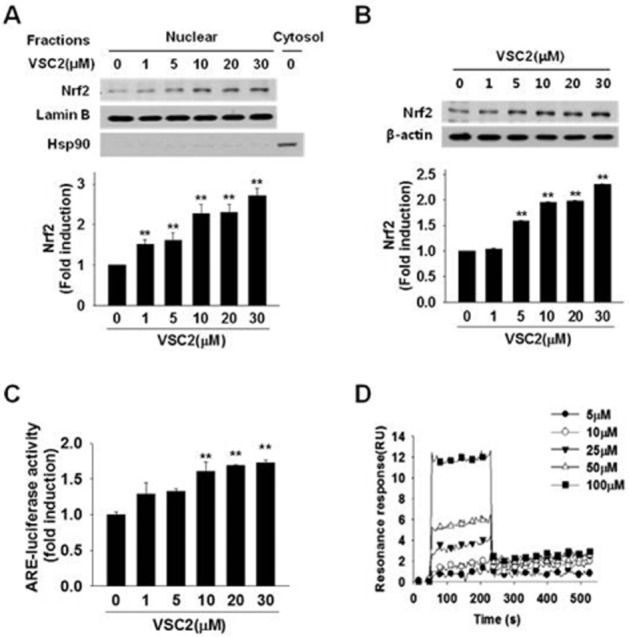
Figure 5.

VSC2 binds Keap1 and activates Nrf2 signalling in microglia. BV-2 cells were exposed to various concentrations of VSC2. (A) The cells were harvested after 3 h and Nrf2 Western blot analysis was performed on nuclear fraction. The same blot was subjected to Western blot against lamin B as an internal control and the cytosolic marker protein hsp90 as a negative control. (B) The cells were harvested after 24 h and Nrf2 Western blot analysis was performed on cell lysate, using β-actin as an internal control. (C) BV-2 cells were transfected with a plasmid containing an ARE-luciferase reporter construct. After 48 h, the cells were treated with various concentrations of VSC2 for 6 h and luciferase activity in the cell lysate was measured. The data are expressed as fold induction of untreated control ± SEM; **P < 0.01 versus untreated control. (D) Surface plasmon resonance analysis was performed to assess binding kinetics between VSC2 and Keap1. The data are expressed as resonance units (RU) as a function of time.
