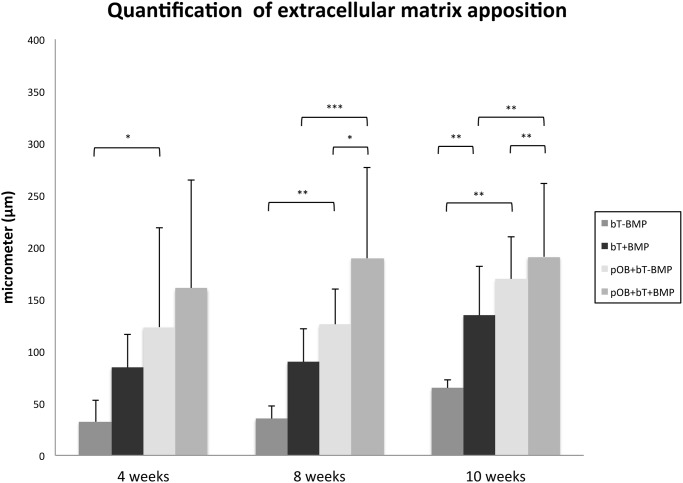
Figure 4. Quantitative histological analysis of extracellular matrix (ECM) formation.
Thickness of group-specific extracellular matrix formation characterized by collagen rich fibers was measured in μm on histology specimens (PAS) under 10-fold magnification. Values are presented as mean ± standard deviation. The asterisks (*) indicate the significant differences between the stimulated and the non-stimulated groups (*p<0.05, **p<0.01, ***p<0.001).

