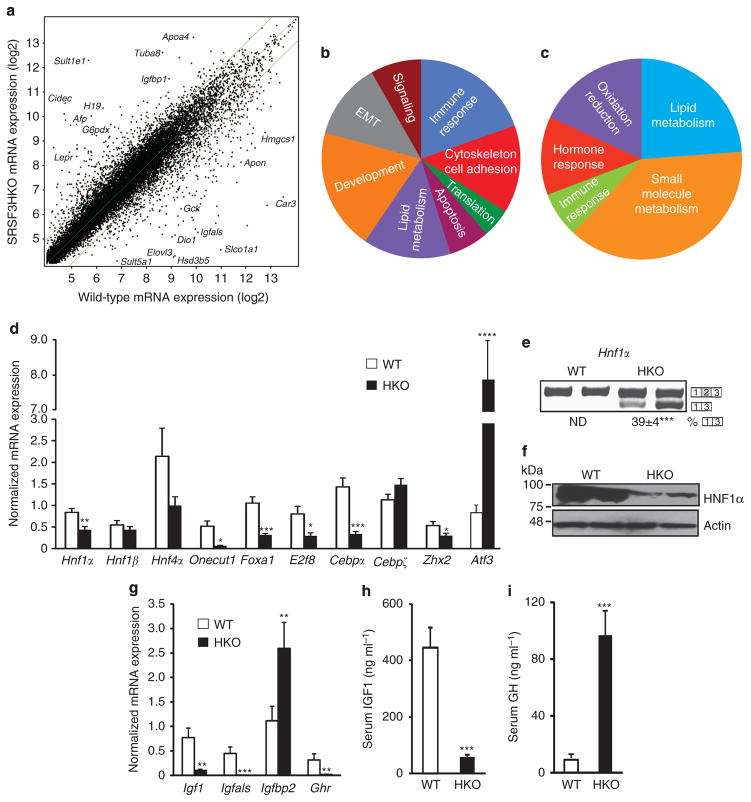
Figure 3. Altered gene expression and GH resistance in SRSF3HKO mice.
(a) Scatterplot of normalized mRNA expression by microarray. Data are log2 normalized. Some of the most highly up- or downregulated genes are indicated. (b) Gene ontology mapping of genes that show significantly altered splicing. (c) Gene ontology mapping of genes that show significantly altered expression. (d) mRNA expression of selected liver transcription factors by qPCR; n = 8. (e) Analysis of Hnf1α exon 2 splicing by RT–PCR. A representative gel is shown with two WT and SRSF3HKO samples with the percentage of exon skipping indicated underneath. ND, not detectable. (f) HNF1α protein expression in hepatocyte lysates by immunoblotting with two representative animals per group. Blots were stripped and reblotted for actin as a loading control. (g) mRNA expression of the known HNF1α target genes Igf1, Igfals, Igfbp2 and Ghr, in SRSF3HKO and WT liver by qPCR. n = 8 (h) Total serum IGF1 in SRSF3HKO and WT mice. n = 7 (i) Serum GH in SRSF3HKO and WT mice. n = 8. Results are means±s.e.m. In all panels, n indicates the number of mice per group, *P<0.05, **P<0.01, ***P<0.001, ****P<0.0001.

