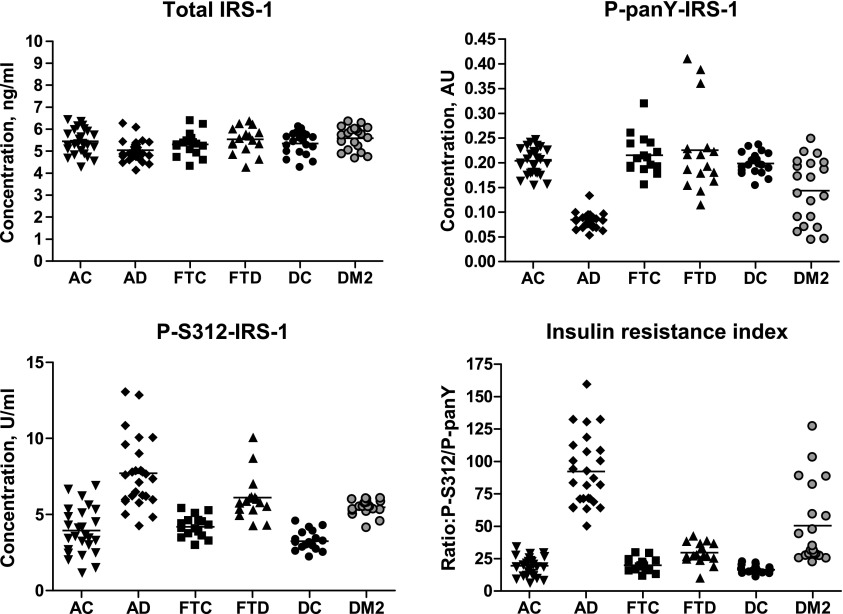
Figure 1.
Cross-sectional analysis of altered levels of phosphorylated IRS-1 in AD, DM2, and FTD. AU, absorbance units at 450 nm; insulin resistance index, ratio of P-serine 312-IRS-1 (P-S312-IRS-1)/P-pan-tyrosine-IRS-1 (P-panY-IRS-1) (R); horizontal line in each cluster of individual values is the mean level for that group.

