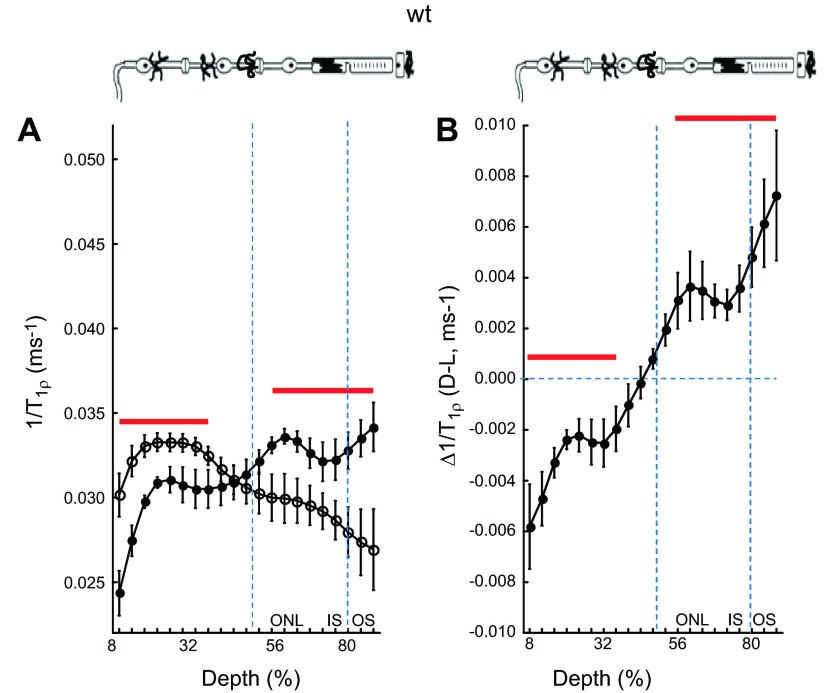
Figure 1.
1/T1ρ MRI measures light- and retinal layer-dependent functional contrast. A) Layer-specific analysis of mean group central retinal 1/T1ρ profiles during darkness (filled circles, D) and light (open circles, L) in untreated WT mice. Profiles are spatially normalized to retinal thickness (0% = vitreous/retina border, 100% = vitreous /choroid border). Regions less than 8% and greater than 88% are not included as a result of partial volume averaging with signal from outside of the retina. Approximate retinal layers (ONL, outer nuclear layer; IS, inner segments; OS, outer segments) are indicated (vertical dotted blue lines) and are assigned based on the fact that in rodents, each retinal layer occupies a similar percentage of the whole-retinal thickness throughout development (40); for example, 80% depth is considered a reasonable estimate of where the IS/OS border is located in the mouse. Red lines = regions with significant differences (P < 0.05) between profiles. The top graph provides simplified schematic of retina and support circulations (58–60). B) Paired-difference profile between dark and light 1/T1ρ (i.e., Δ1/T1ρ) profiles in WT mice using the data in (A). Red lines indicate regions with significant differences (P < 0.05) from zero (horizontal dotted blue line).

