Figure 5.

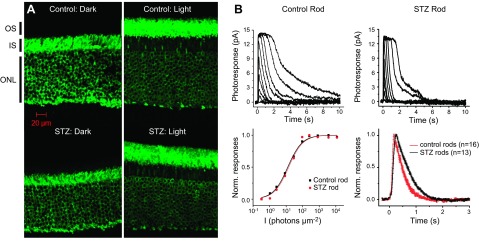
Confirming predications ex vivo made by 1/T1ρ MRI functional topography about tet-ARR1 and its reduction translocation in the diabetic mouse. A) Immunohistochemical analysis performed using anti-S-antigen/ARR1-peptide-specific rabbit polyclonal antibodies of ARR1 translocation in control (top row) and diabetic (bottom row) mouse retinas collected either in the dark (left column) or 20 min after light exposure (right column). These data support the results shown in Fig. 4B. We also investigated visual cycle activity in the diabetic murine retina, which has been suggested to have an impaired visual cycle that may in turn affect ARR1 translocation (6, 22). Representative families of flash responses from control (top left) and STZ diabetic (top right) mouse rods. Flash intensities for both families of responses increased from 0.34 photons µm−2 for the dimmest flash in increments of 0.5 log units. The corresponding intensity-response data (bottom left) were fit by the Naka-Rushton function, R/Rmax = I/(I + I1/2), where R is the response amplitude, Rmax is the saturated rod response amplitude, I is the test flash intensity flash intensity, and I1/2 is the flash intensity required to produce a half-maximal response. Bottom right panel shows the population-averaged normalized dim flash responses, with their rising phases shown in detail in the inset. Error bars are ±sem. These data further support the results in Fig. 4.
