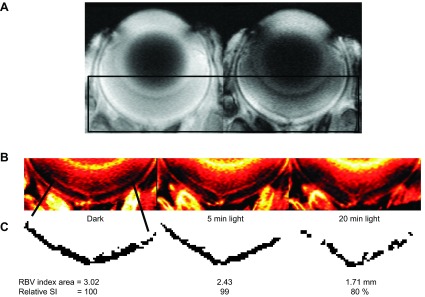
Figure 6.

Supporting a prediction that inner retinal 1/T1ρ reflects light-evoked changes in retinal vascular volume. A) Gradient-echo images in a dark adapted uninjected mouse (left) and MION-injected (20 mg Fe/kg) mouse (right). Black box indicates region of interest highlighted in (B). B) ΔR2* maps calculated from the images in (A) representing retinal blood volume index maps with dark adaptation, and at 5 and 20 min after light exposure. C) Segmentation of inner retina circulation and analysis results.
