Figure 1.
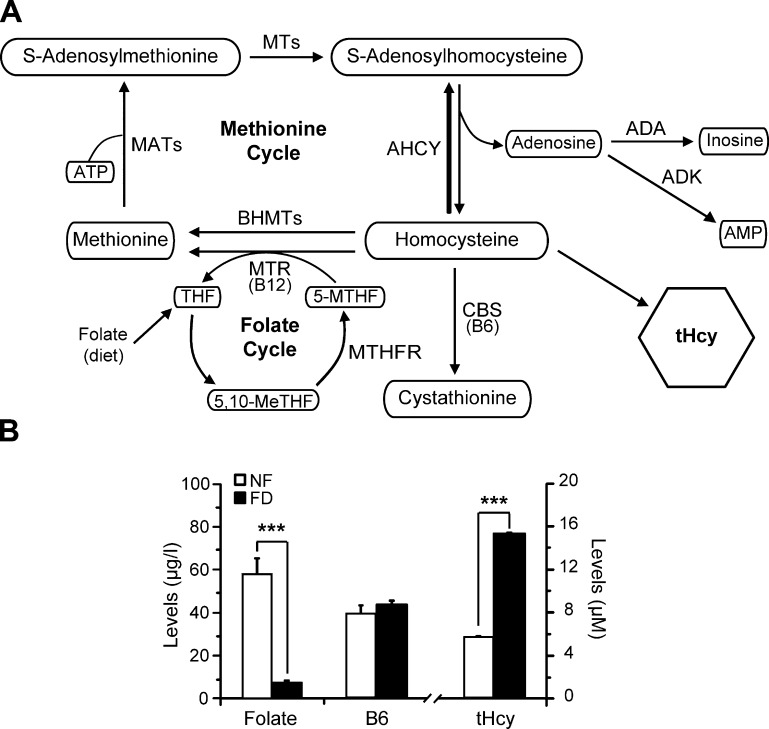
Pathways involved in Hcy metabolism and systemic metabolite levels. A) Scheme of Hcy metabolism and related pathways. Metabolites appear in white boxes, and the enzymes listed include the following: ADA, ADK, AdoHcy hydrolase (AHCY), BHMTs, AdoMet-dependent methyltransferases (MTs), MATs, vitamin B6-dependent CBS, MTHFR, and vitamin B12-dependent MTR. B) Serum and plasma metabolite levels from all animals in both normal (NF) and FD groups are shown. Serum folic acid [50.85 ± 22.03 (n = 10) vs. 7.46 ± 3.88 μg/L (n = 11)], tHcy [5.05 ± 2.45 (n = 33) vs. 14.70 ± 3.19 μM (n = 69)], and plasma vitamin B6 levels [40.00 ± 15.71 (n = 11) vs. 43.71 ± 8.74 μg/L (n = 18)] were measured as specified under Materials and Methods. The figure shows the mean ± SEM for each group, and differences were considered significant when P ≤ 0.05; ***P < 0.0001.

