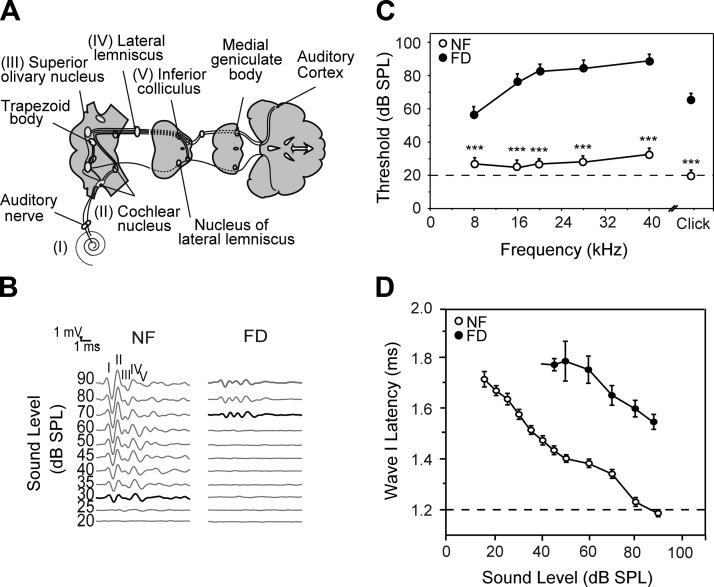
Figure 2.
FD mice show early signs of hearing loss. The auditory response was analyzed in mice of normal (NF) and FD groups. A) Scheme of the auditory pathway adapted from Murillo-Cuesta et al. (32). B) Representative ABR recordings obtained in response to click stimuli of NF (showing normal hearing) and FD mice (showing profound hearing loss). C) ABR thresholds in response to click and tone burst stimuli in NF (○) and FD (•) mice, after 8 wk of diet (n = 21 for each group). D) Latency-intensity functions for wave I of NF and FD mice showing a delay in the appearance of the wave. Data are shown as the mean ± SEM. ***P < 0.001.

