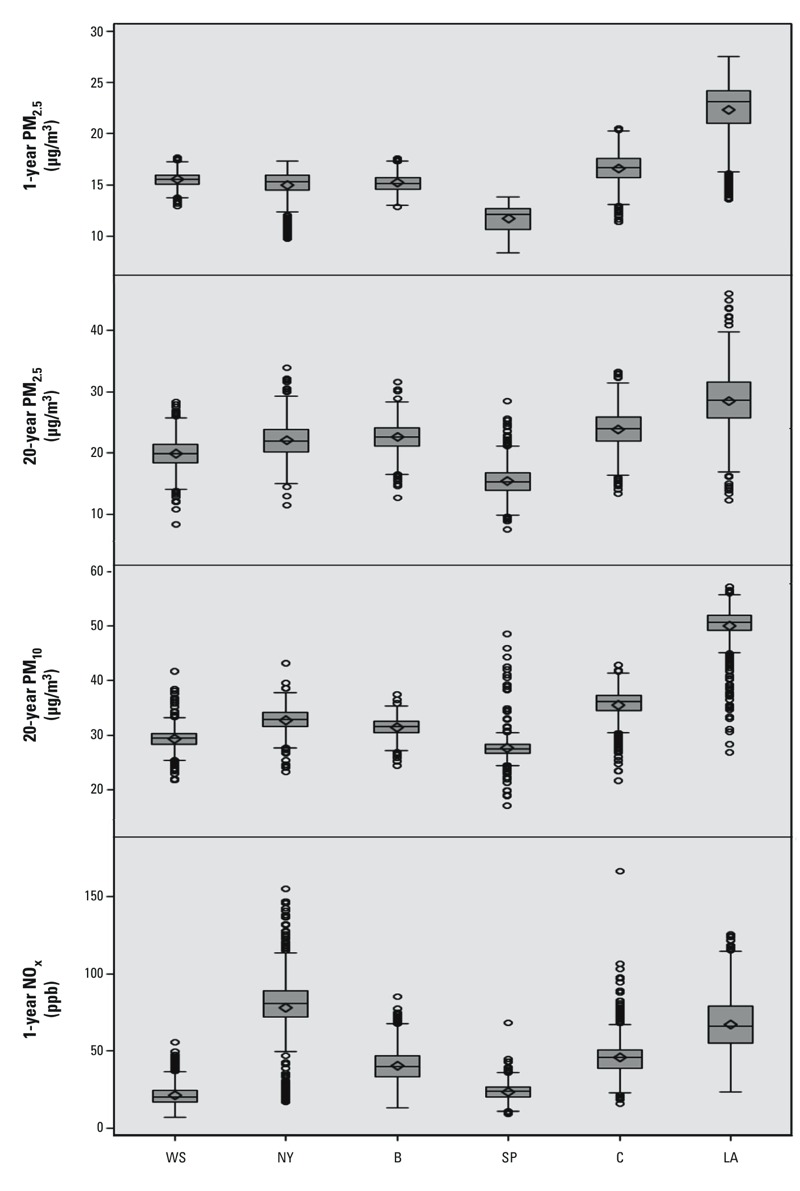
Figure 1.

Distribution of individual-level estimates of long-term PM2.5, PM10, and NOx concentrations at participant residences by city and averaging period. Abbreviations: B, Baltimore; C, Chicago; LA, Los Angeles; NY, New York; SP, St. Paul; WS, Winston-Salem. Scales vary by plot. Boxes extend from the 25th to the 75th percentile, horizontal bars represent the median, diamonds represent the means, whiskers extend 1.5 times the length of the interquartile range above and below the 75th and 25th percentiles, respectively, and outliers are represented as points.
