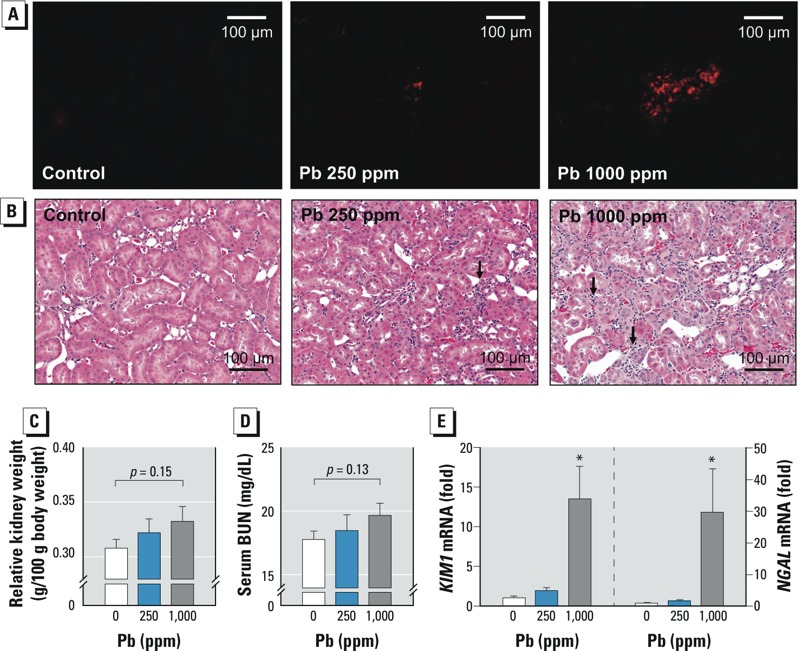
Figure 4.

Renal damage associated with erythrophagocytosis in rats treated with Pb2+ [0 (control), 250, or 1,000 ppm] for 12 weeks. (A) Generation of ROS in kidney measured by DHE fluorescence. (B) Representative photomicrographs showing histopathological changes evaluated by H&E staining; bars = 100 μm. Relative kidney weight (C) and the level of BUN in serum (D). (E) Changes in NGAL and KIM1 mRNA levels in kidney detected by qRT-PCR. Values are the mean ± SE of 6–9 rats/group; data were subjected to one-way ANOVA followed by Student’s t-test (C,D) or Duncan’s multiple range test (E). *p < 0.05 compared with the corresponding control.
