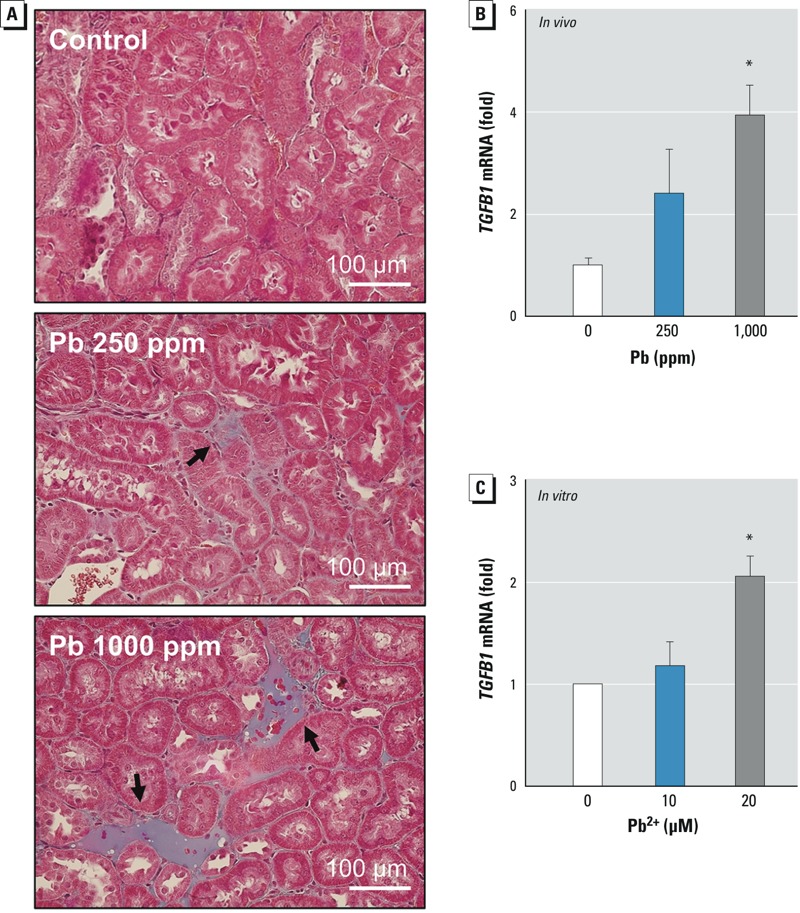
Figure 5.

Renal fibrosis following Pb2+ exposure. (A,B) Rats were treated with Pb2+ [0 (control), 250, or 1,000 ppm] for 12 weeks, and kidneys were isolated. (A) Representative photomicrographs showing fibrotic collagen deposition examined by Masson trichrome staining (black arrows); bars = 100 μm. (B) The level of TGFB1 mRNA in the kidney quantified by qRT-PCR; values shown are the mean ± SE of 5 rats/treatment group. (C) mRNA level of TGF-β in HK-2 cells after co-incubation with Pb2+-treated erythrocytes [0 (control), 10, or 20 μM Pb2+] for 4 hr; values shown are the mean ± SE of five experiments. Data were subjected to one-way ANOVA followed by Duncan’s multiple range test. *p < 0.05 compared with control.
