
Figure 5.
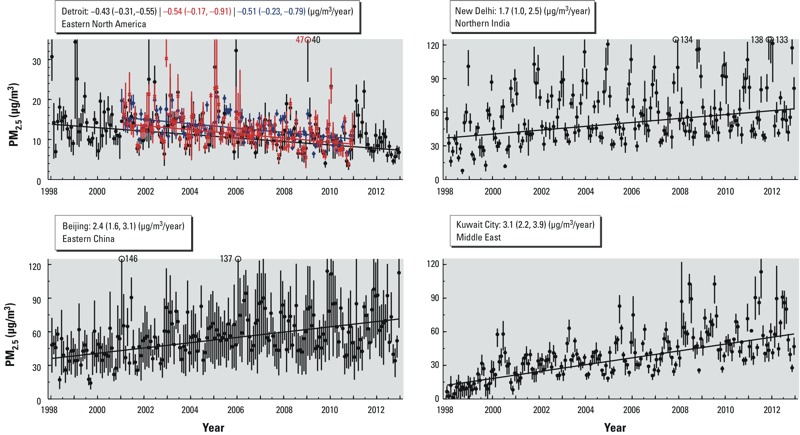
PM2.5 time series at the four sub-areas identified in Figure 4. Black dots and vertical lines denote monthly mean and 25th–75th percentile of satellite-derived values. Corresponding ground-level monitor (red x) and satellite-derived coincident with ground-level monitor (blue diamonds) PM2.5 are also shown for Detroit in the same notation. Trend and 95% CIs based on these values are provided in the keys. Supplemental Material, Figures S4–S6, overlay satellite-derived PM2.5 values with those collected from the literature for Beijing, New Delhi, and Kuwait City.