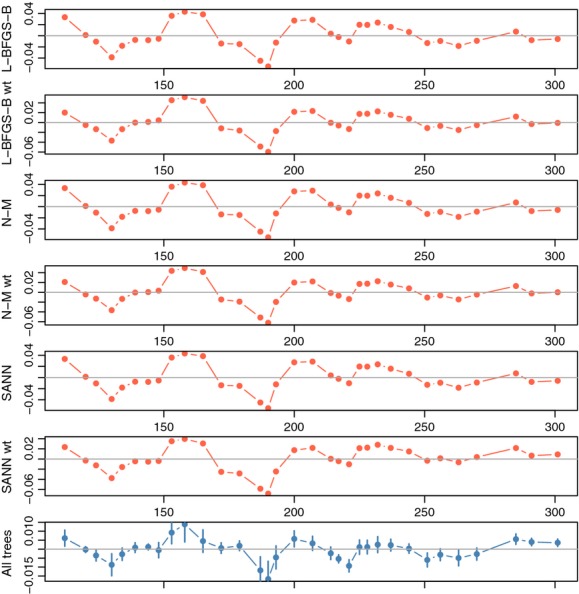
Figure 4.

Residuals for the four LG5 models. The first six panels show residuals from the expected optimized model for a single tree (see Fig. 3A), and the last panel shows means of all 20 trees, with two standard errors from the mean shown in segments. Despite different species, locations, and sizes, the residuals show similar growth increment responses to weather during the growing season.
