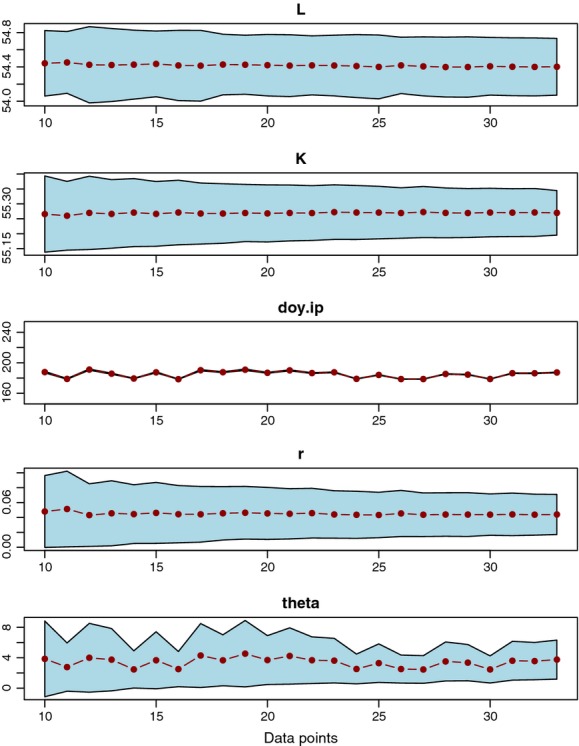
Figure 5.

Parameters fit to different measurement frequencies. The five parameters from the output for tree number 1 are shown with 95% confidence intervals in blue. Connected dots show the parameter estimates. The x-axis shows the number of data used to fit the model, with 33 days of data being the full data set. In all sets, the first and the last days of data were retained and then remaining N−2 data points were retained in a roughly evenly distributed fashion (see Appendix S1 for details). Plots show that uncertainty is conserved across sample sizes, except for the inflection day (doy.ip), which has narrow CI, but changes for different fits.
