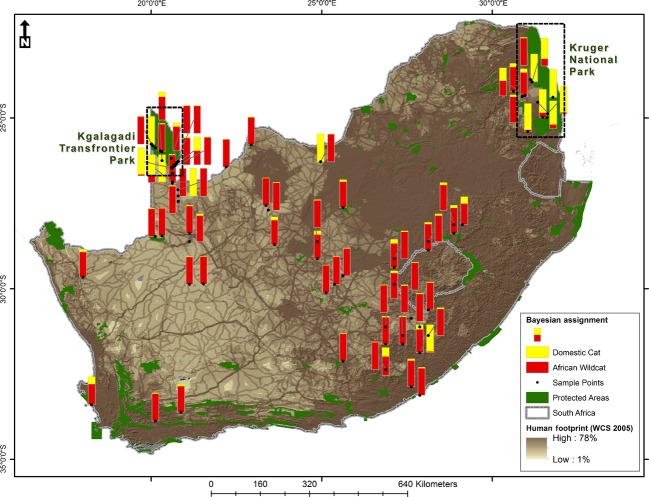
Figure 2.
Distribution of collection sites of cats included in this study across South Africa in relation to formal protected areas and human footprint pressure. The proportion Bayesian assignments based 13 microsatellites of sampled localities to the African wildcat (qAWC) and domestic cat (qDC) genetic groups are indicated as bar graphs. As African wildcat genetic purity (proportion Bayesian assignment to the African wildcat cluster) increases, there is an associated decrease in the global human footprint influence index (P = 0.0003) and an increase in the distance to the nearest town (P = 0.026).

