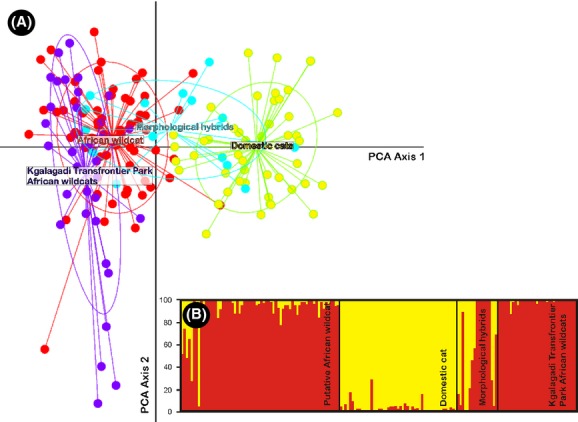
Figure 3.

(A) Scatter plot of Principle Components Analysis showing the genetic structure between putative African wildcats (red), African wildcats from the Kgalagadi Transfrontier Park (purple), domestic cats (yellow), and morphological hybrids (light blue). (B) STRUCTURE bar plots where vertical axes illustrate the proportional assignment of individual genomes to the inferred genetic groups (K = 2) for African wildcats outside protected areas, domestic cats, morphological hybrids, and individuals from the Kgalagadi Transfrontier Park. Membership of each individual's genome (qAWC/DC) to the two identified genetic clusters is indicated by different colors of vertical bars (red, African wildcat; yellow, domestic cat).
